Development Diary
These diary entries will cover the implementation process of the application for this project.
RSVM.js
Entry 1 (18/07):
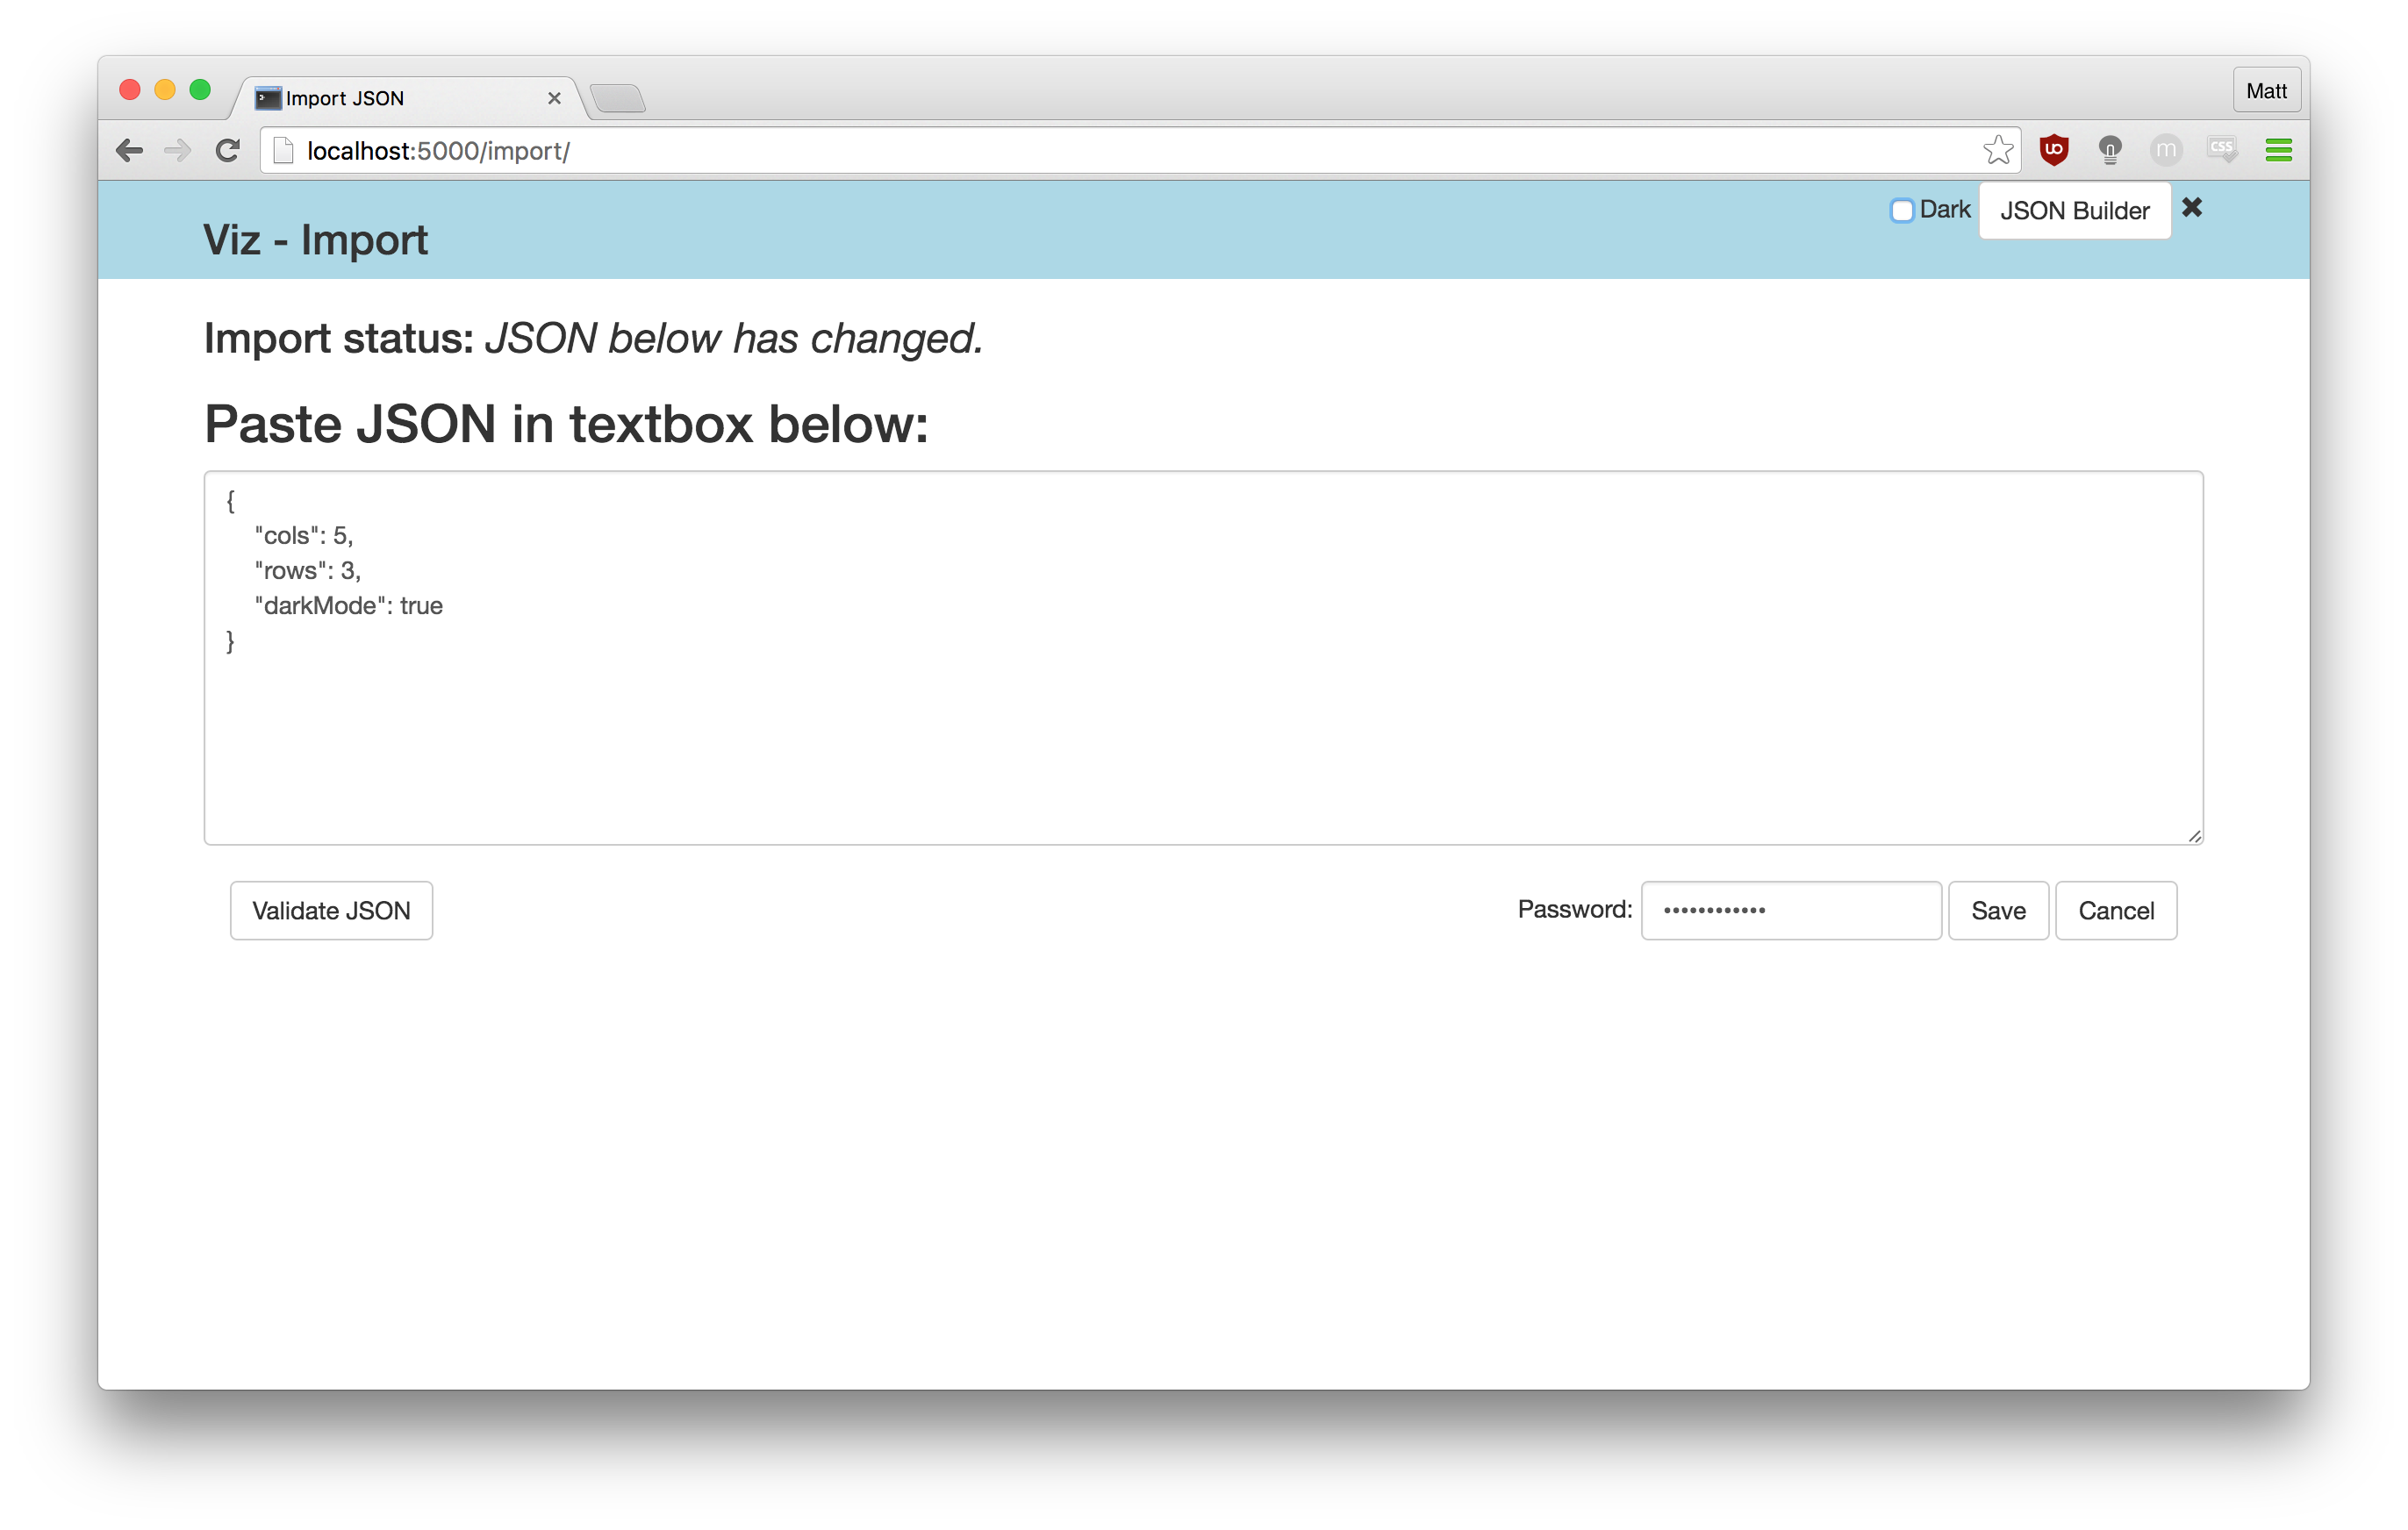
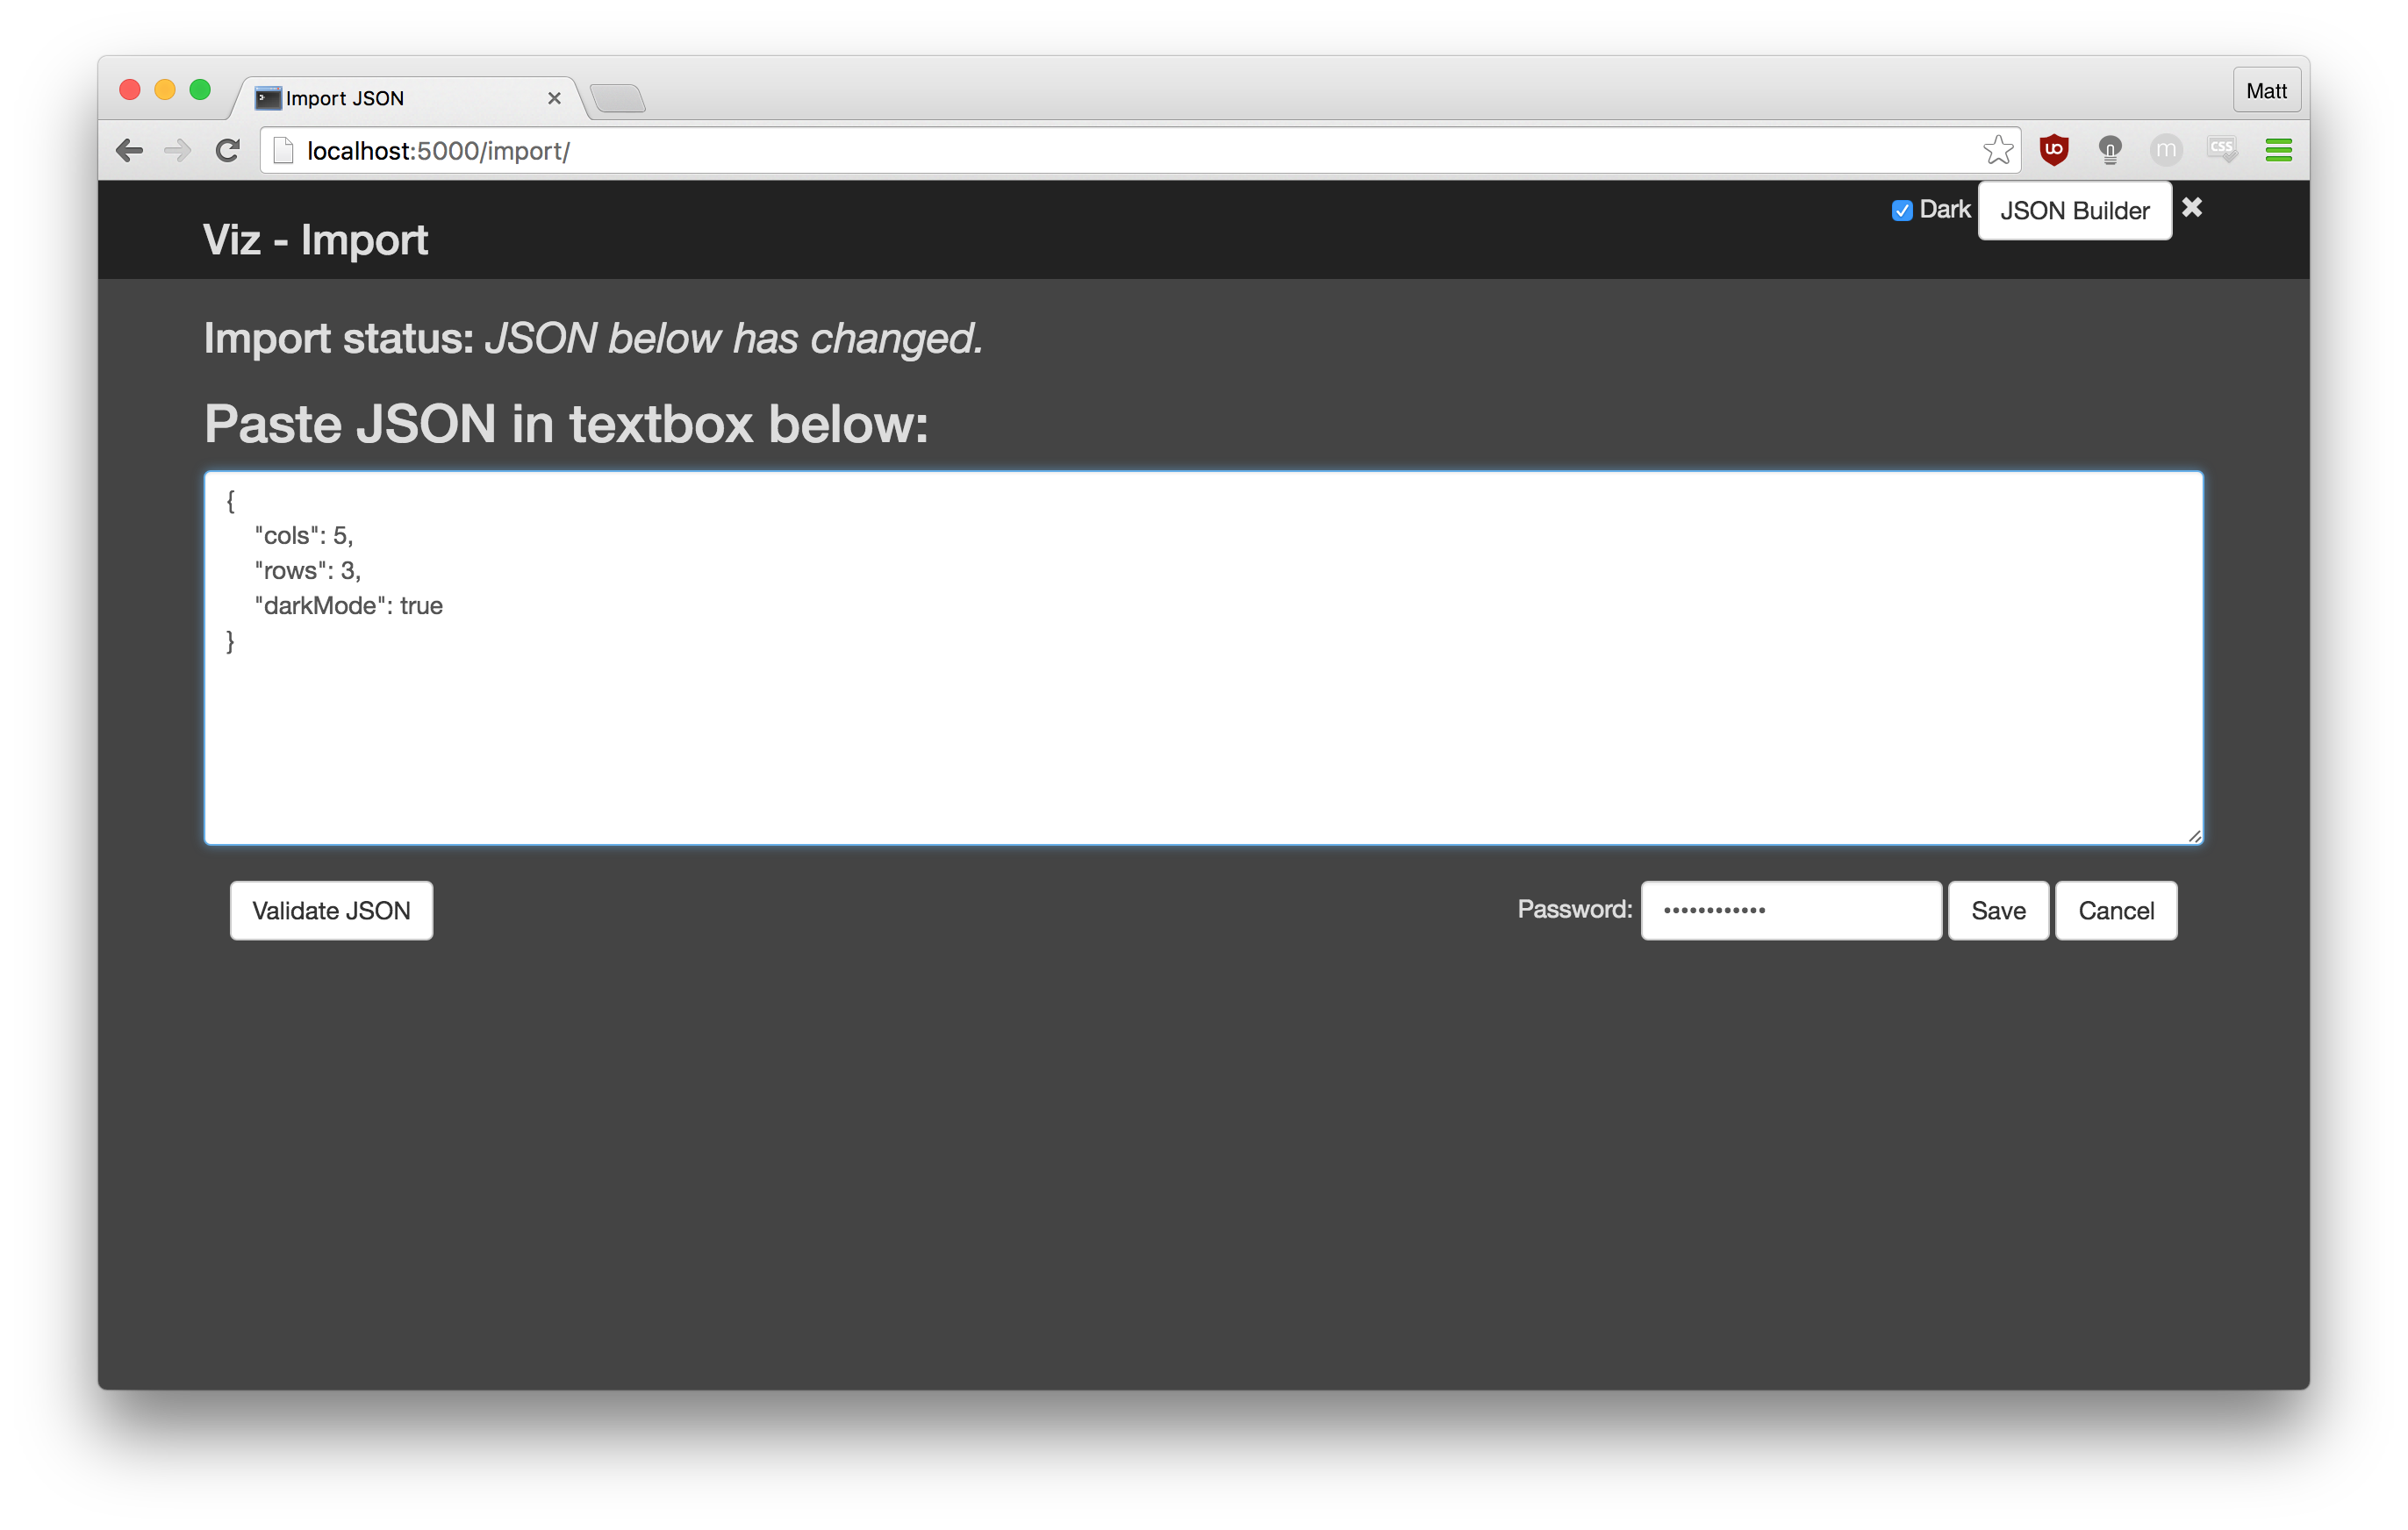
Today, a lot of progress was made towards the import JSON page. It is now functionally complete, including saving and retrieving the JSON and the darkmode / standard (as shown below). A few styling changes will be made after which no more changes should be needed.
Entry 2 (19/07):
Today the import page was completed excluding final visual styling (which will be completed once all the pages are finished functionally). As well as completing the import page, the settings page was also started; due to using templates it was very easy to get the page set up. Next the form will be added so that settings can easily be generated.
Entry 3 (20/07):
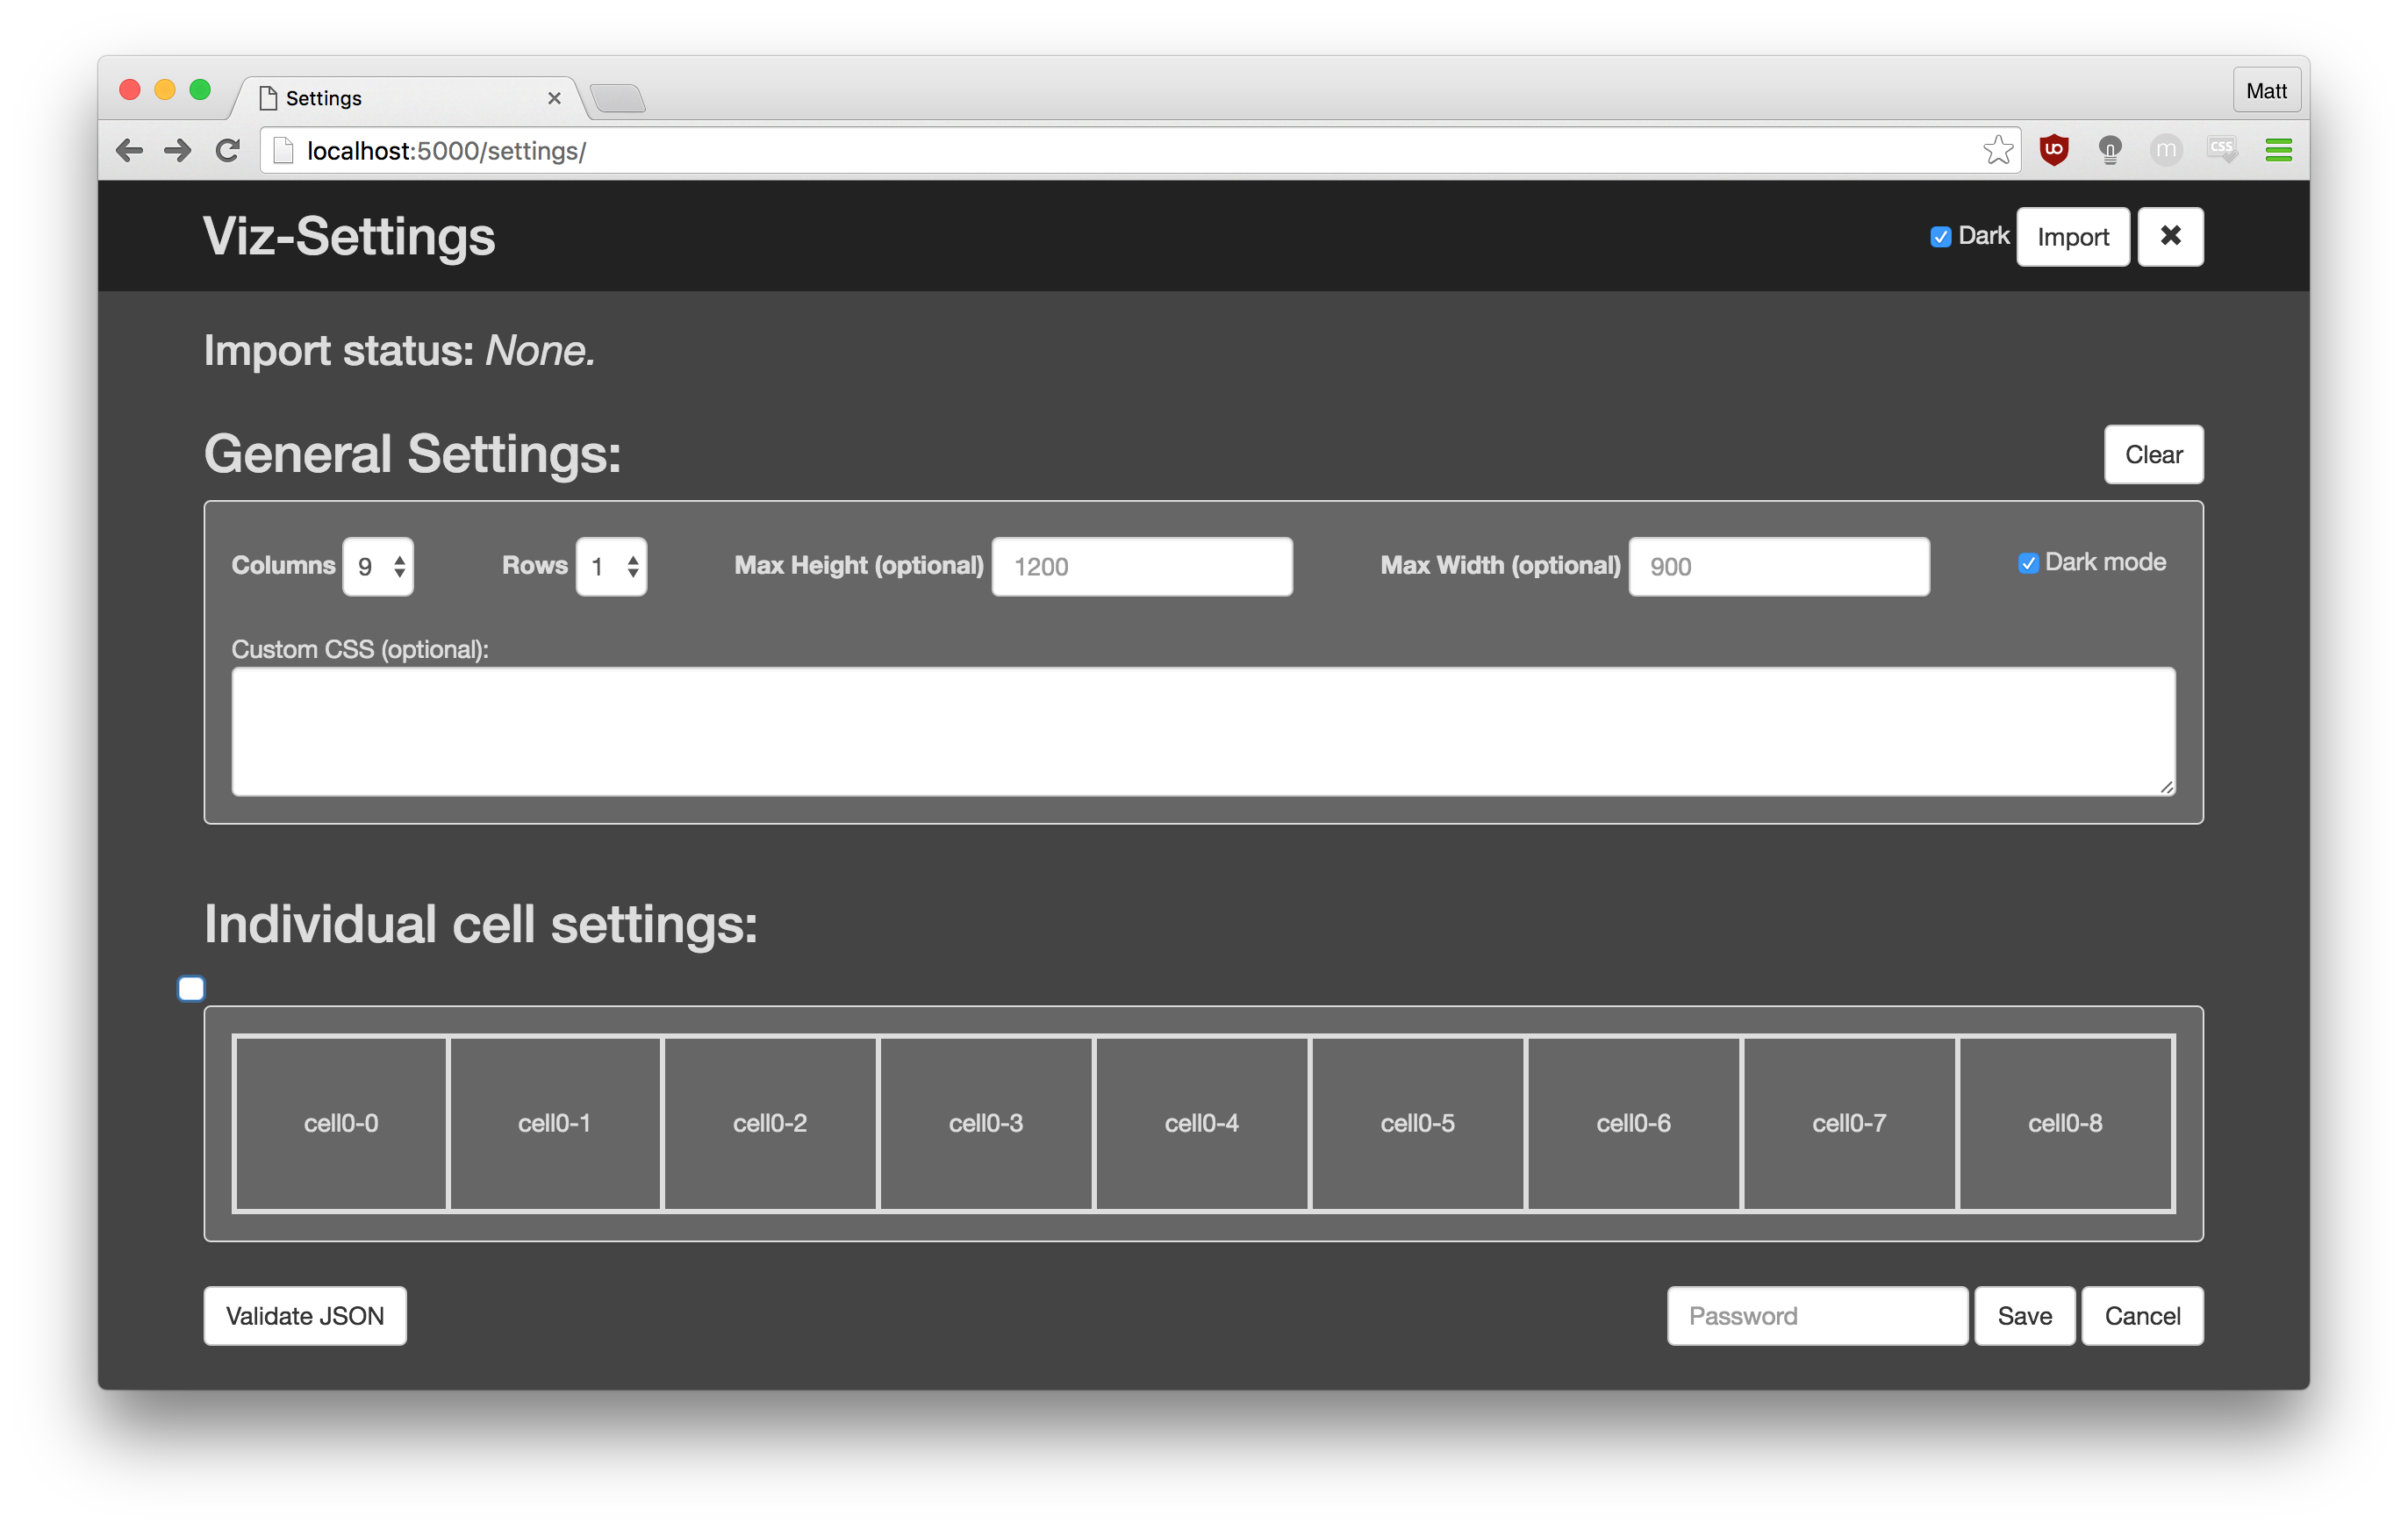
A lot of progress was made with the settings page. The front end has now been created, which enables a user to configure all of the settings to generate a configuration. Next, validation testing will be added to this page, as well as it getting connected to the back end so that the configuration can be saved to the server.
Entry 4 (21/07):
The settings page now hides cells that are part of a group of merged cells. Next the JSON generation, exporting and saving will be completed.
Entry 5 (22/07):
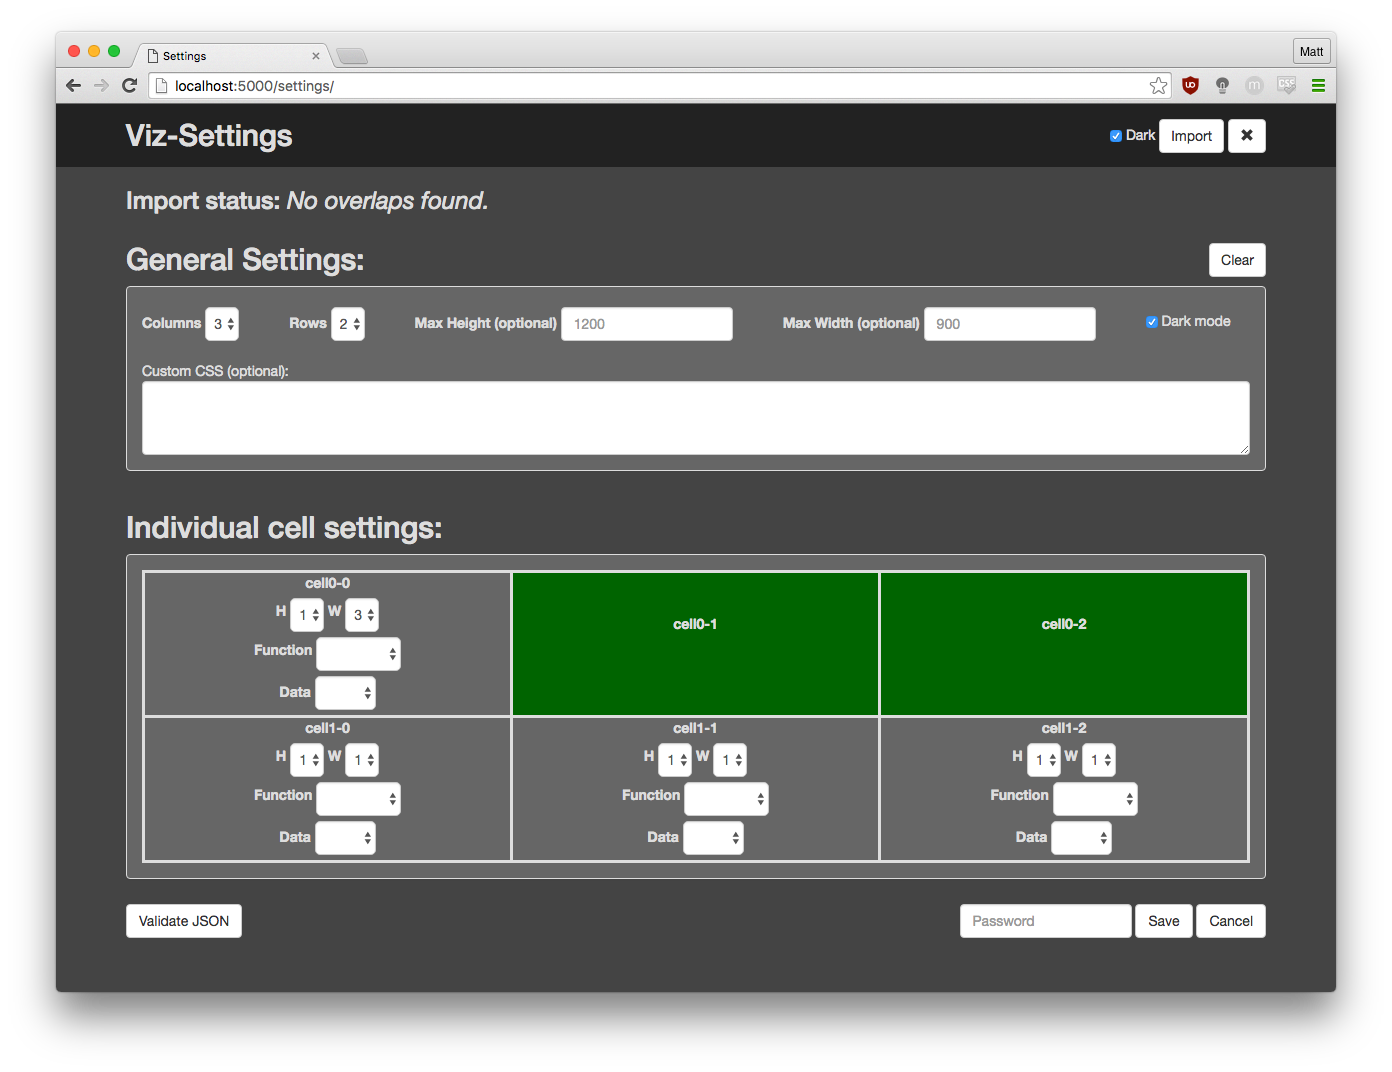
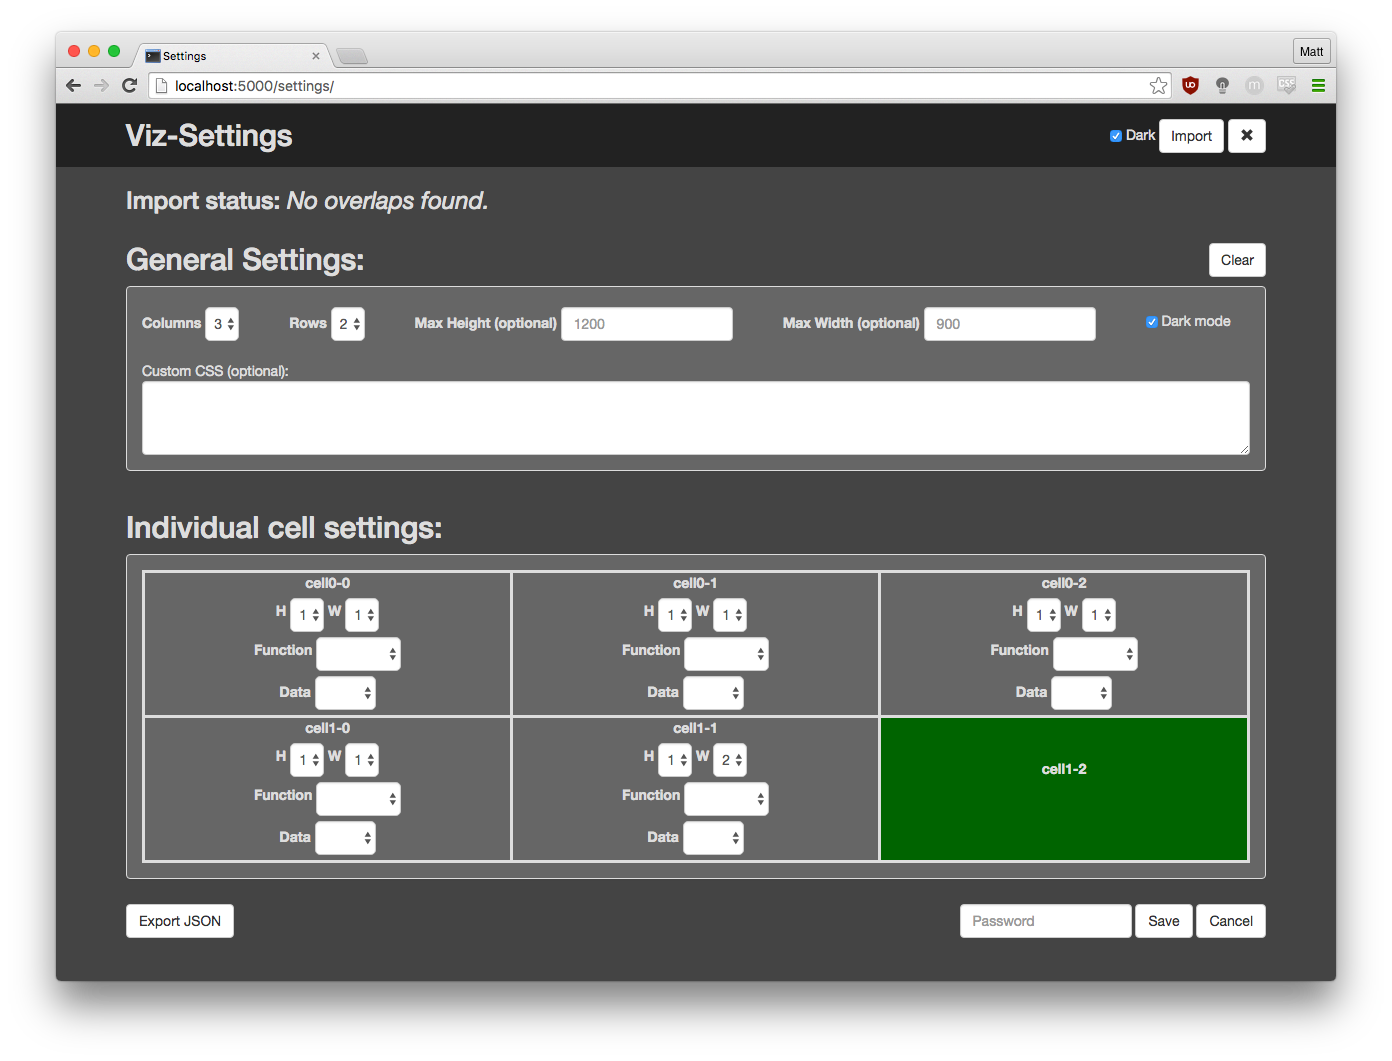
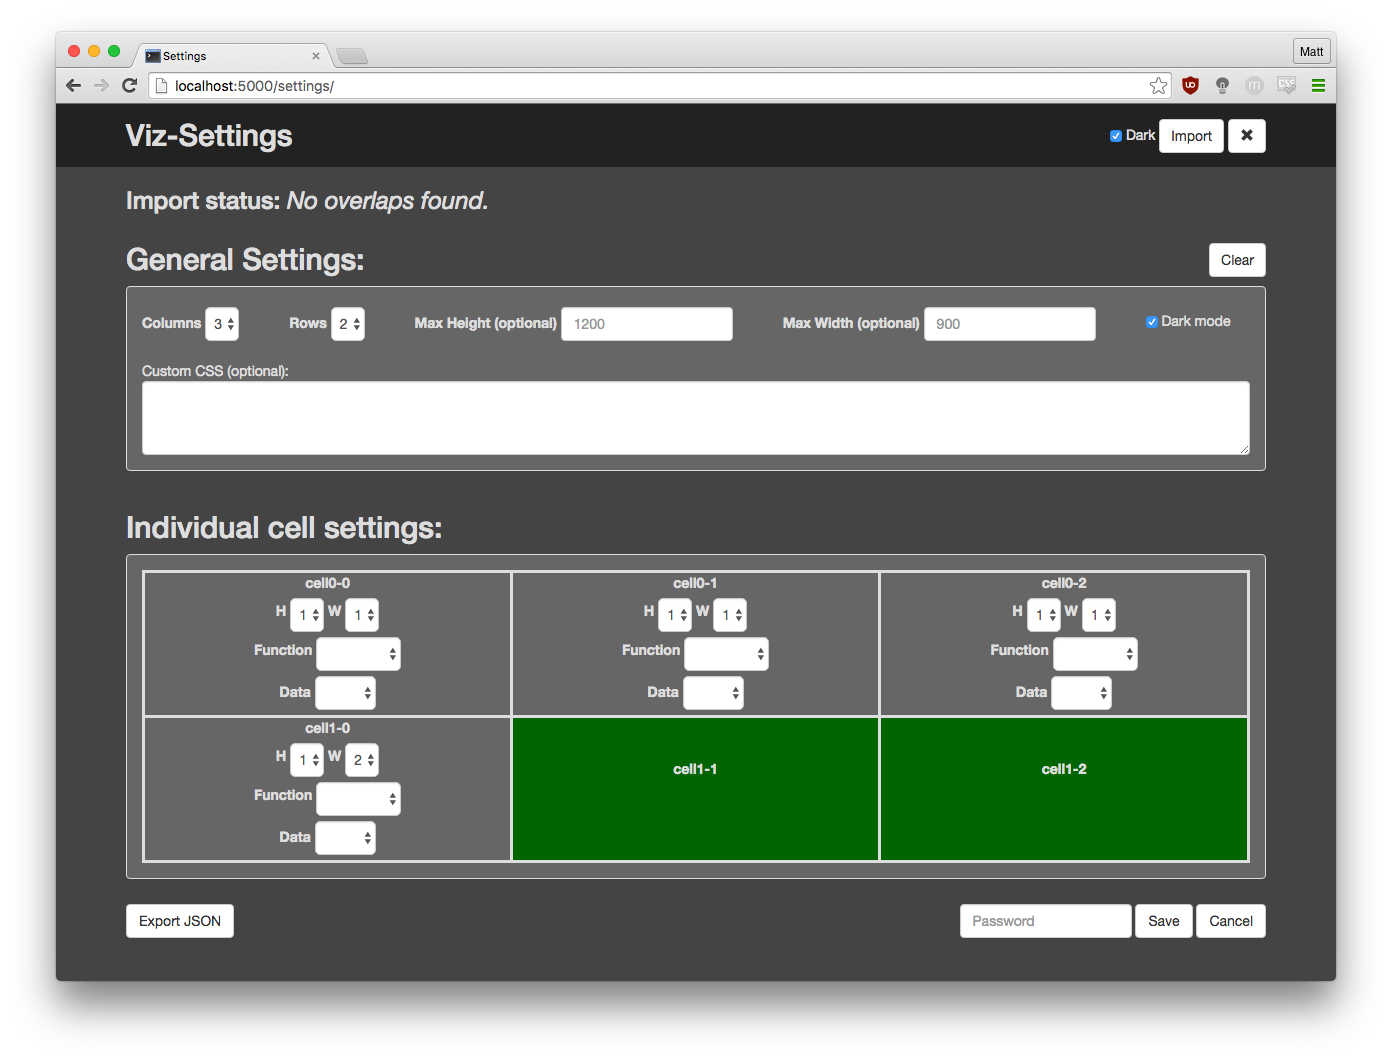
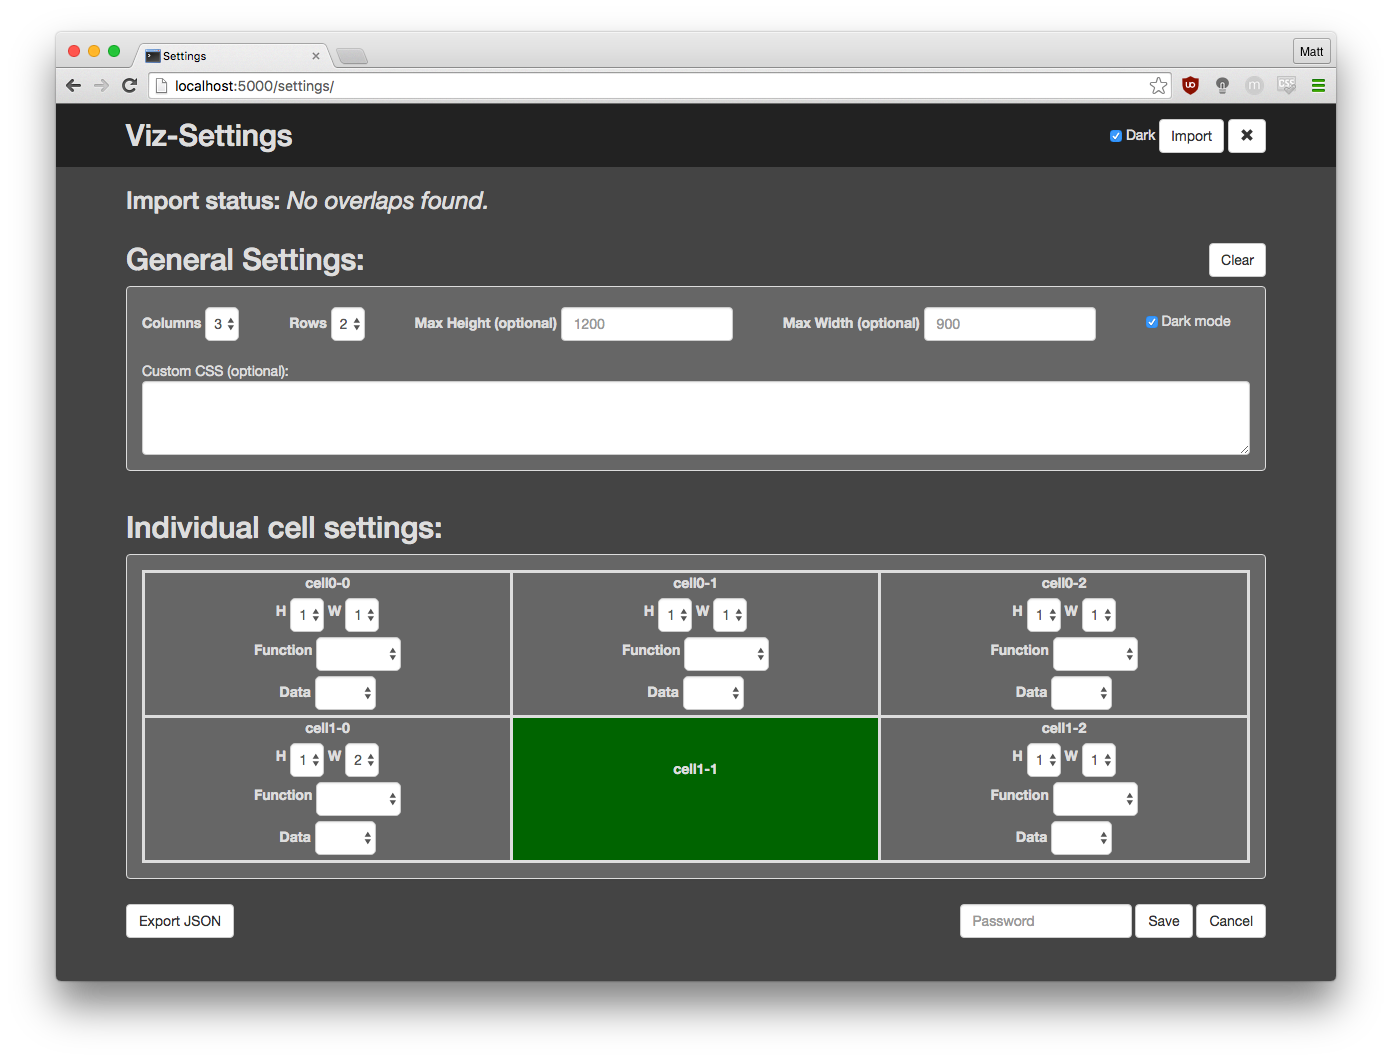
Found an issue with the cell merging where if a cell that merges other cells gets merged the initial cells stay merged. Fixed the issue so that the initial cells get released if their parent gets merged. First two screenshots below show the issue. The third screenshot shows the issue has been fixed.
Entry 6 (24/07):
JSON can now be exported (copied to clipboard) and saved to the server. Now that configurations can be saved, the cell data needs to be imported like the general settings currently are.
Entry 7 (25/07):
The cell data is now imported when the settings page loads. Now all that is left, excluding the final CSS tidy up at the end, is to extend the validation checking beyond just checking that the JSON string is valid JSON. The continuation of this and implementing 'validationTester.html' will be completed next.
Entry 8 (26/07):
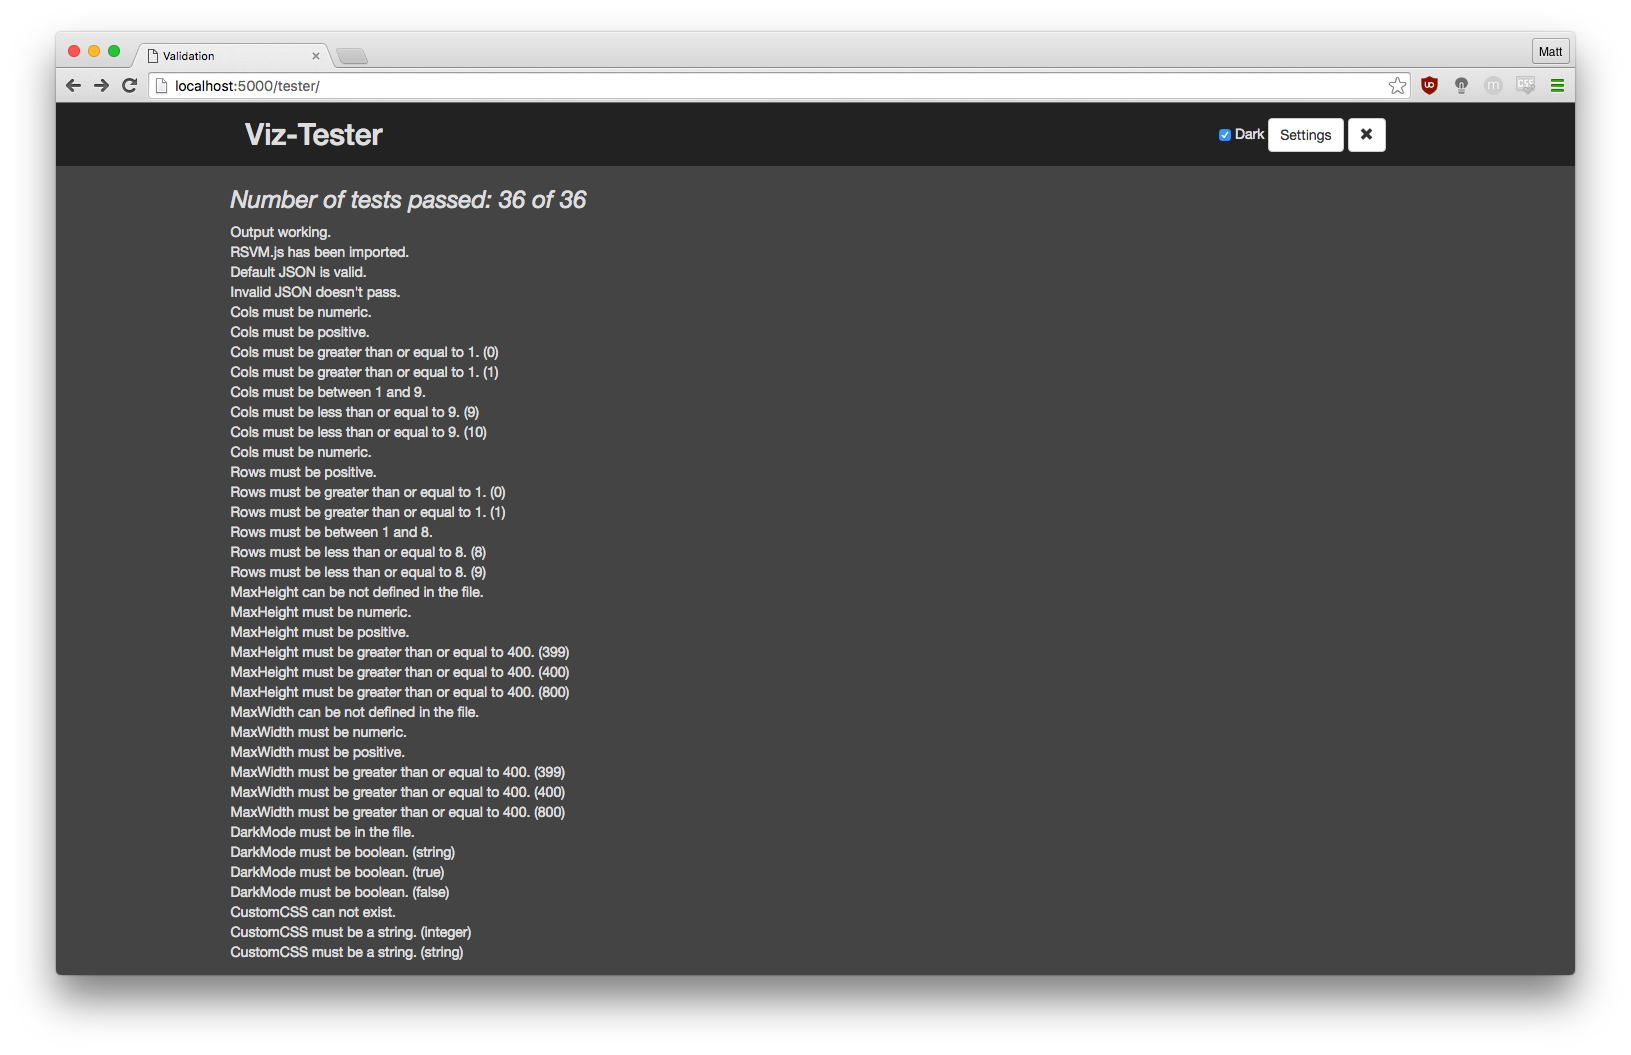
A validation tester was created with 36 tests, testing all of the settings set within "general settings" as shown below. The next task is to generate the application from the stored JSON.
Entry 9 (27/07):
Refactored the header and set up the header for the application page. The final step of setting up the application is to read the JSON and create the application from it.
Entry 10 (28/07):
Finished generating the application from the JSON. That is all that can be done on the front end for now. The next step is to reconfigure the Twitter stream and data store.

Back end
Entry 11 (29/07):
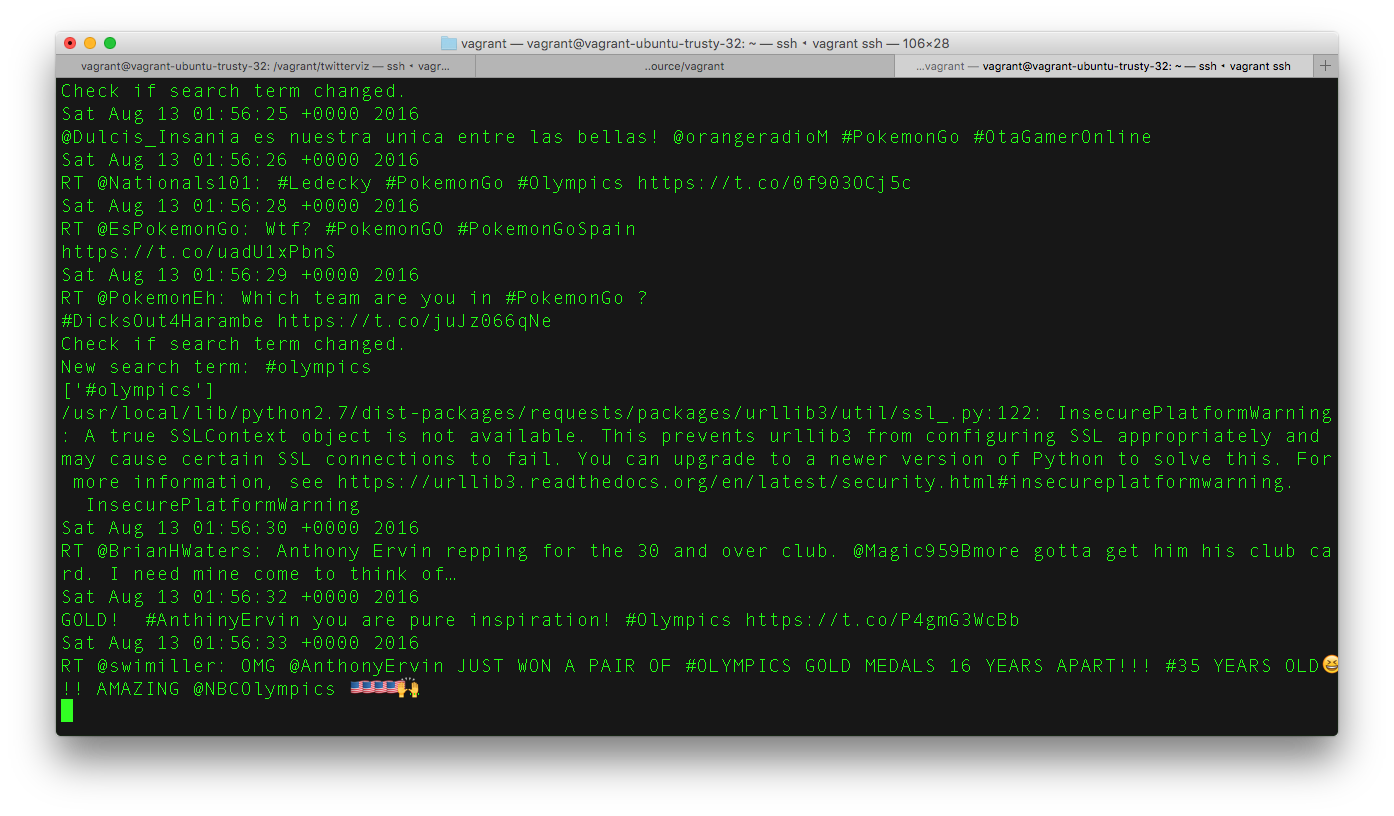
Working on the back end now. Used the proof of concept as a starting point. Updated the 'getstream.py' file to read the search term from file (so that it can be updated from 'web.py' by the user through the front end). Added limit to the rate at which the search term can be changed, and fixed the issue of being unable to stop the script from running. Screenshot below shows changing the search term from 'pokemongo' to '#olympics'.
Entry 12 (30/07):
Set up the database for the individual tweet data. There will also be another two tables created later, one for the location data and another for the overall summary.
Entry 13 (01/08):
Back working on the front end for a short time. Found a number of issues that need fixing, which include:
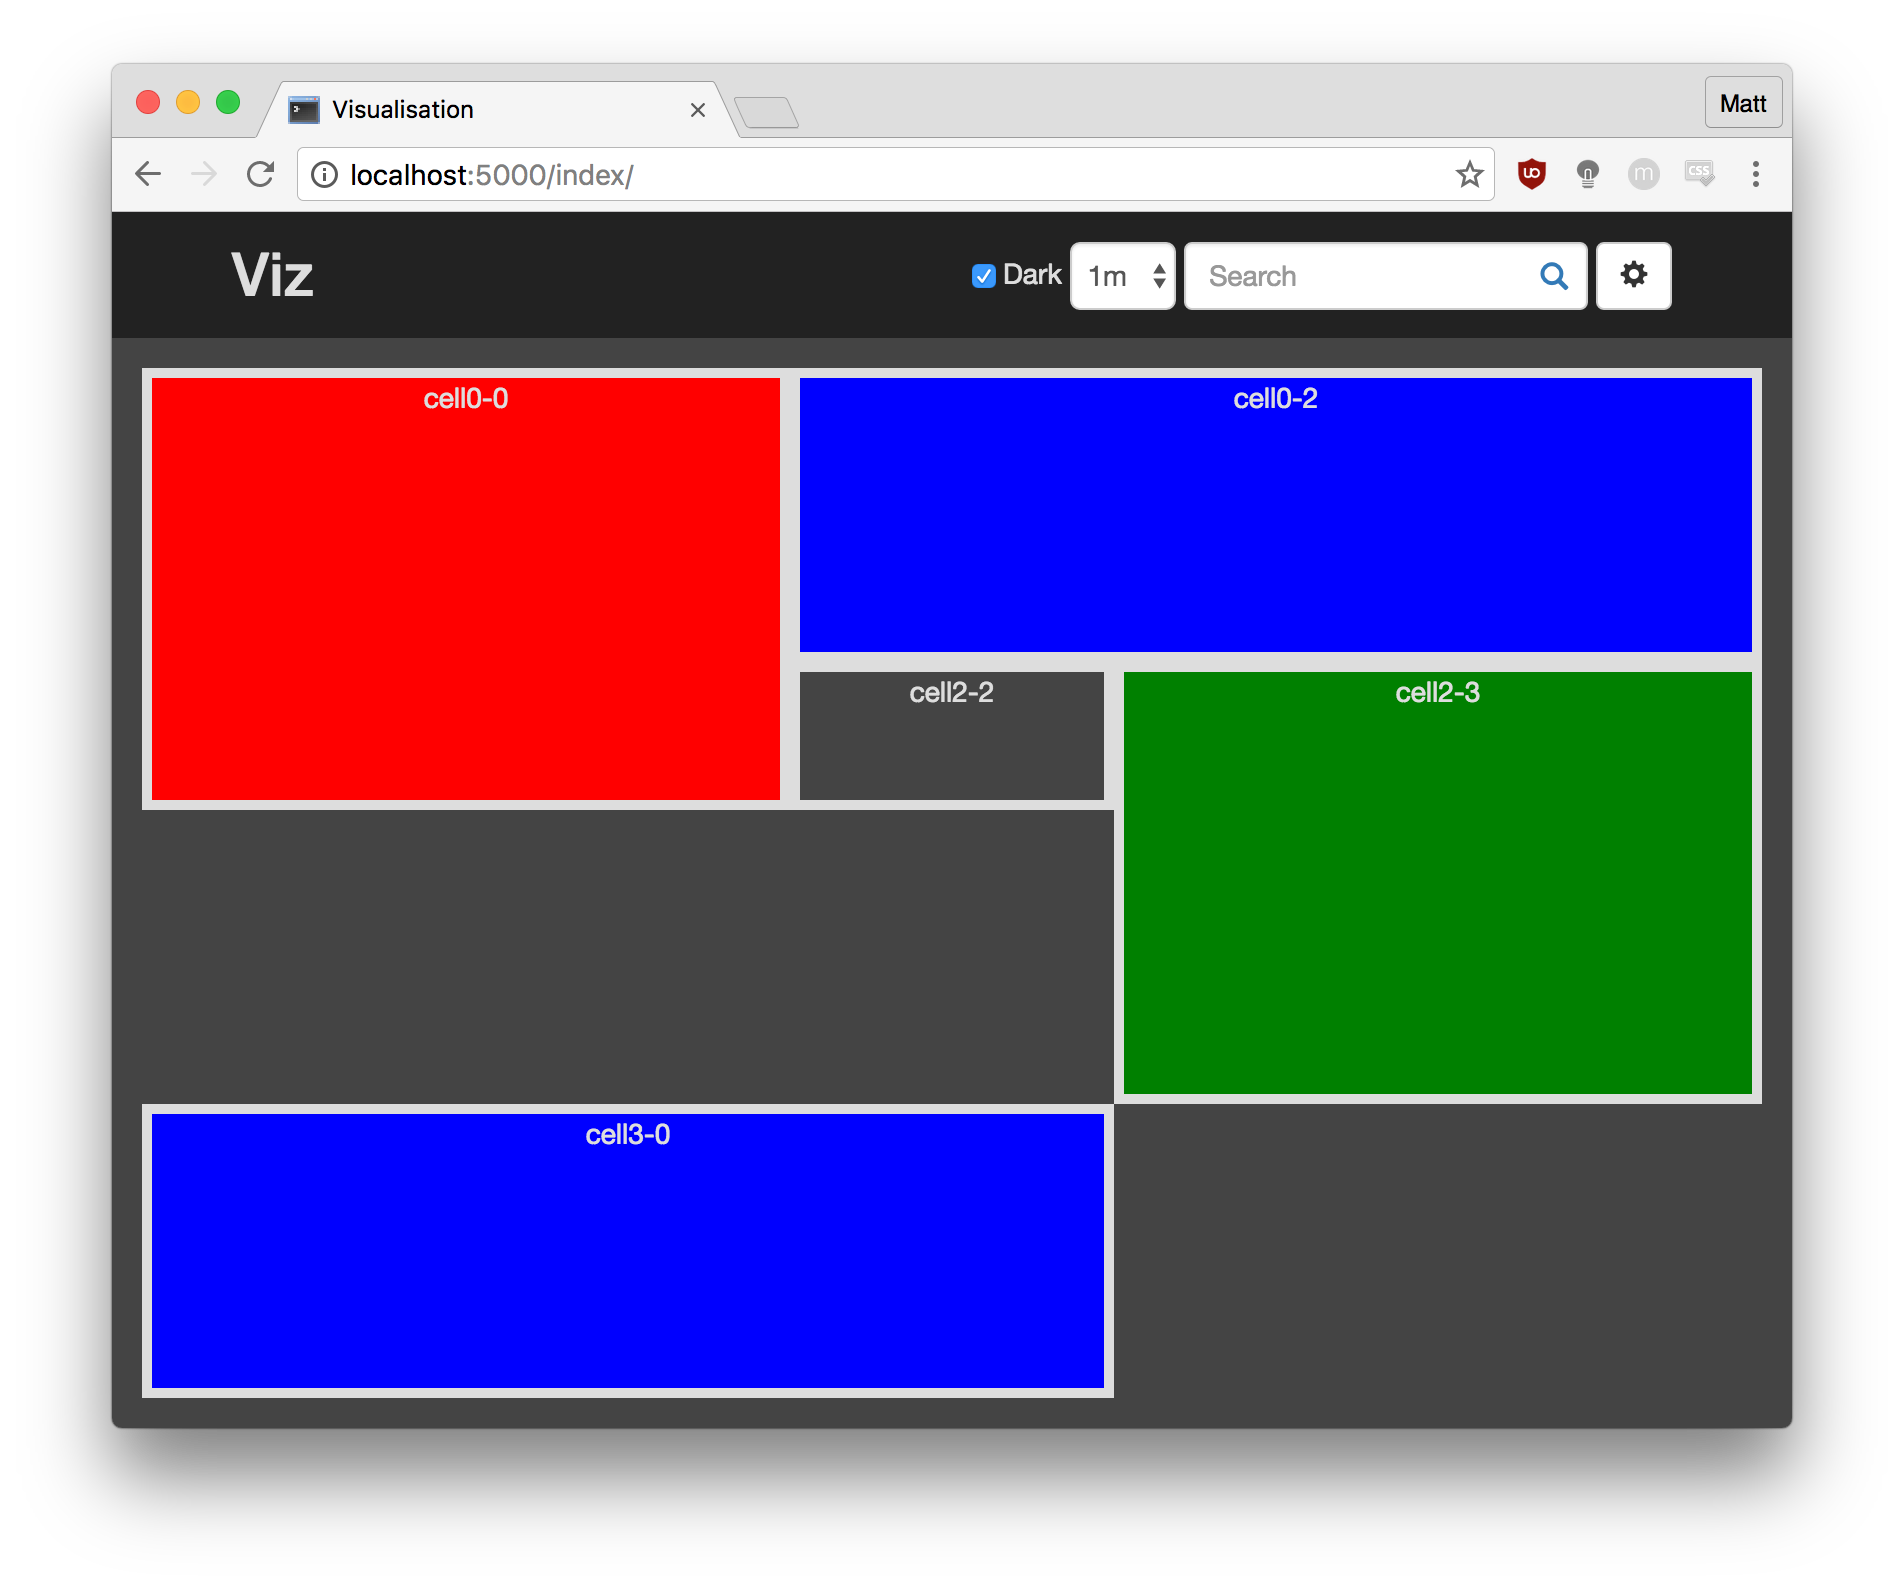
- Cells (using css float: left;) don't always appear as expected (shown below)
- Mobile viewport is not being activated.
- After changing the number of rows / columns the overlap checking is not enforced.
- Dropdowns replace the blank options when applying the settings from the JSON.
- Confirmation on leaving the page should be added in some places and removed in others.
- The cells do not resize to fill the page when the browser window is resized.
Each of these issues have now been fixed; most required minor changes to the code, the mobile viewport issue was because of the DNS settings of the server.
Entry 14 (02/08):
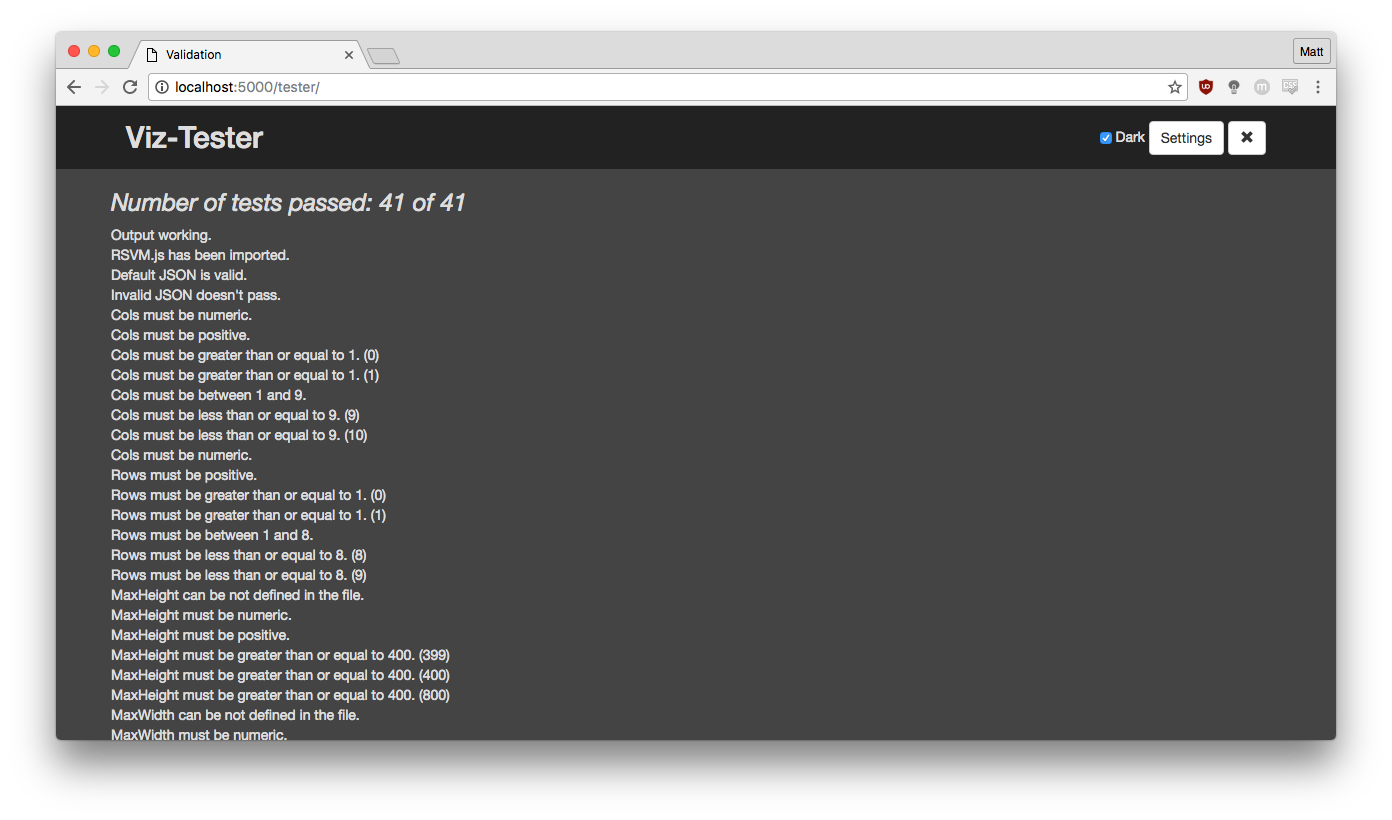
Added validation for the cell settings as well as some more tests. There are now 41 tests to confirm that the 'valiJson' function is working correctly. Output of the [domain]/tester file is shown below. (The list of tests continues below the bottom of the screenshot.)
Entry 15 (03/08):
After a little break, back working on the back end now. The database has been created using SQLAlchemy and it can now be read from and written to.
Entry 16 (04/08):
Got the tweet data from Twitter's API using Tweepy and began to process some of the fields that will be stored. Most are now automatically stored, though some will require more that just extracting the data from the tweet JSON. The next job is to finish getting and processing all of the data.
Entry 17 (05/08):
There were issues with the tweet data character set, some time was spent fixing them. Then worked on getting country data from an external service: implemented both geopy and Google Maps before realising that both would block this application after 10 to 15 minutes due to the number of requests that are required (1 request per tweet that have their country specifically set.)
Entry 18 (06/08):
Now that all data can be stored, it is time to create some read functions (found in database_read.py). There will be a number of different proceedures so that the best one for the task can be used. For example, one to get all the data for the last x seconds, for when the application loads. Then a different one to request the new data every second.
Entry 19 (08/08):
Having created the read functions for the database, the next step was to configure the web server so that requests for the data could be made and those requests would return the correct data. The front end is now able to access tweet data.
Visualisations
Entry 20 (09/08):
Started creating visualisations. No Twitter data is being used for them at this point but it is starting to look closer and closer to the sketches.

Entry 21 (10/08):
Found a number of other issues with the back end. Will fix them before countinuing work on the front end.
Entry 22 (11/08):
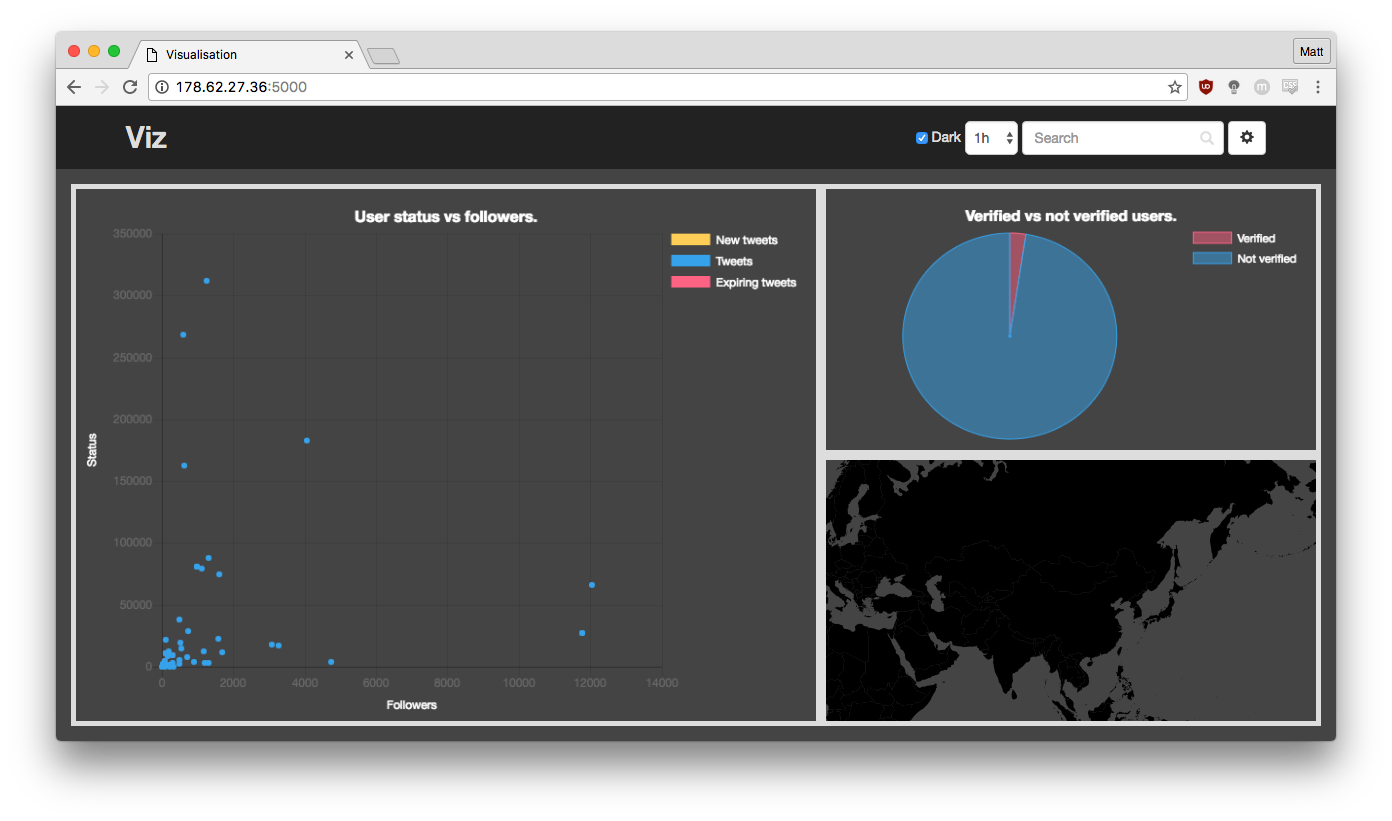
Pie chart and scatter chart now update using Twitter data!
Entry 23 (12/08):
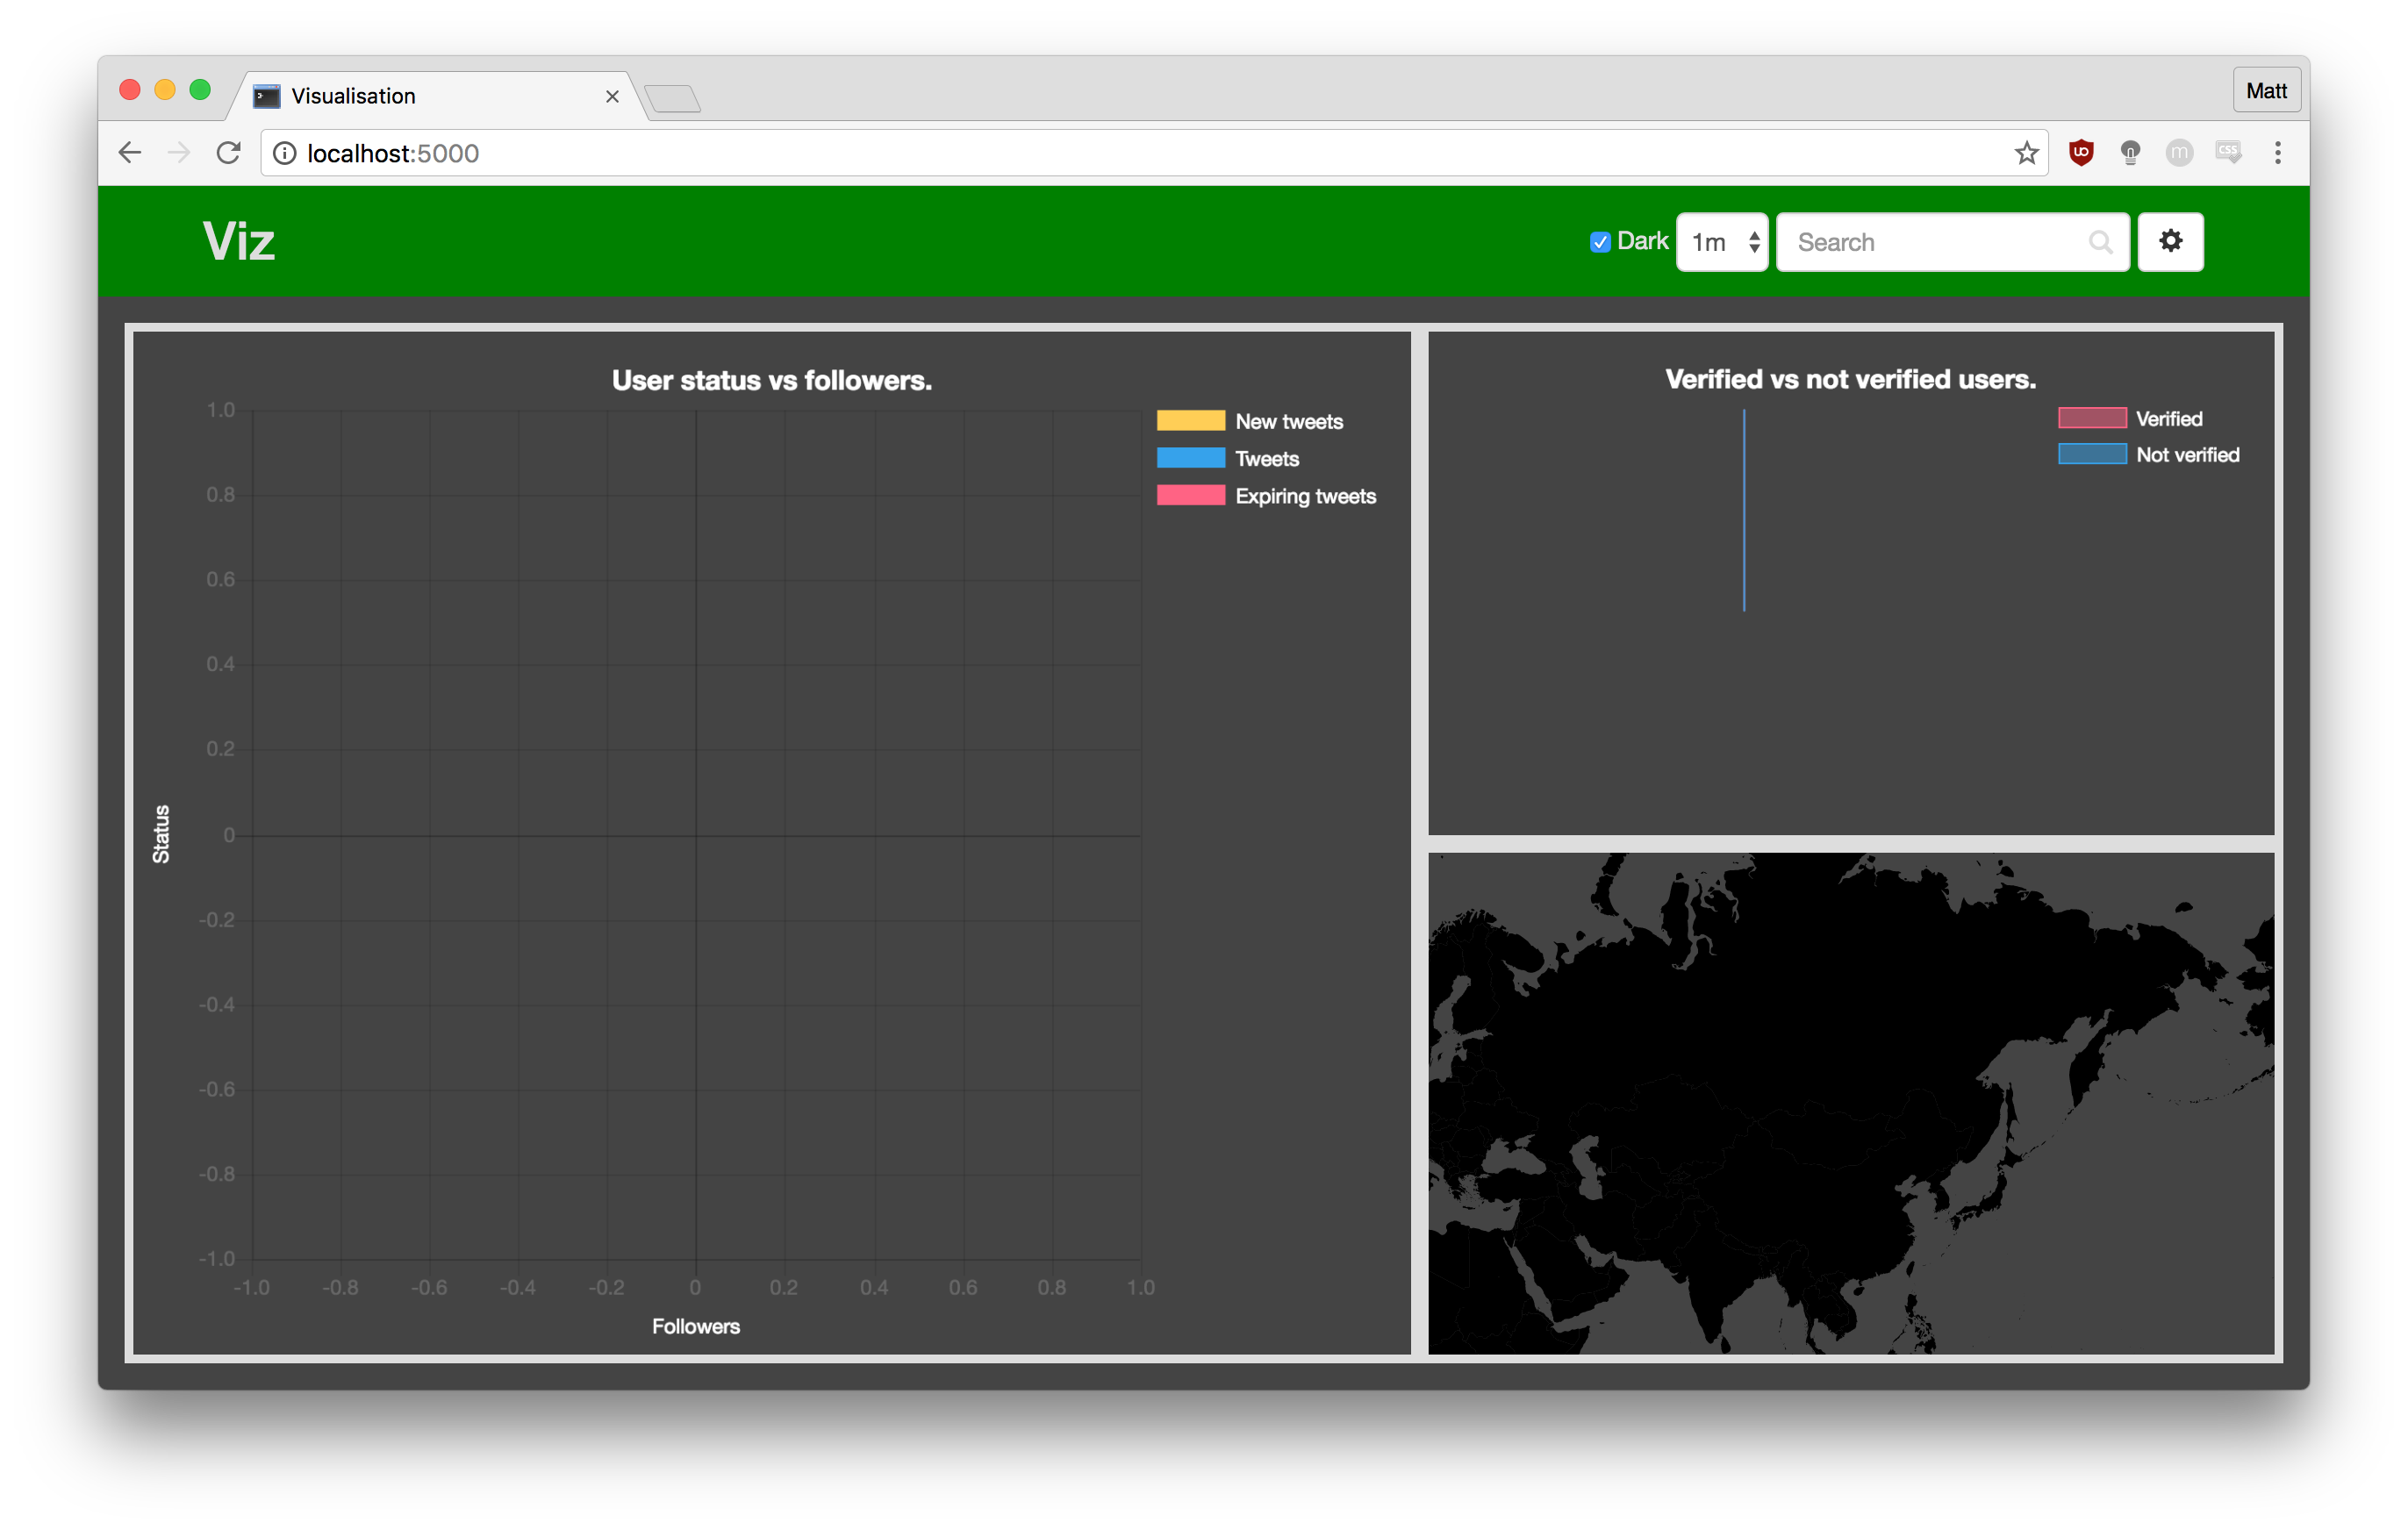
Made the custom CSS and max width and max height variables work. The example below had the following entered into the customCSS textbox.
header {background-color: green !important;}
Entry 24 (13/08):
Due to the nature of this visualisation, the application will request data very regularly. Time was spent optimising exactly when and how often the application polls for data.
Entry 25 (15/08):
Pie chart and scatter plot now redraw after new Twitter data is received. These two are now fully functioning visualisations.
Entry 26 (16/08):
Due to the way that the visualisations were originally coded, using variables to store the charts, for example:
var pie = new Chart()...
it was not possible to have multiple of the same type of visualisation. Now the variable usage has been changed to this:
var chart[divId] = new Chart()...
it is now possible to use multiple of the same type of chart in the same visualisation.
Entry 27 (17/08):
In the same way that the storing of the charts was improved, the data used to generate the charts is now being stored in the same way. Having made this change there should now be no limit to the visualisations that are being generated in terms of storage.
Entry 28 (18/08):
Moved the development server from my laptop to an external server. Took a bit of time to set up but things were starting to slow down and fail due to processing power. The application will now be developed on a Digital Ocean droplet.
Entry 29 (19/08):
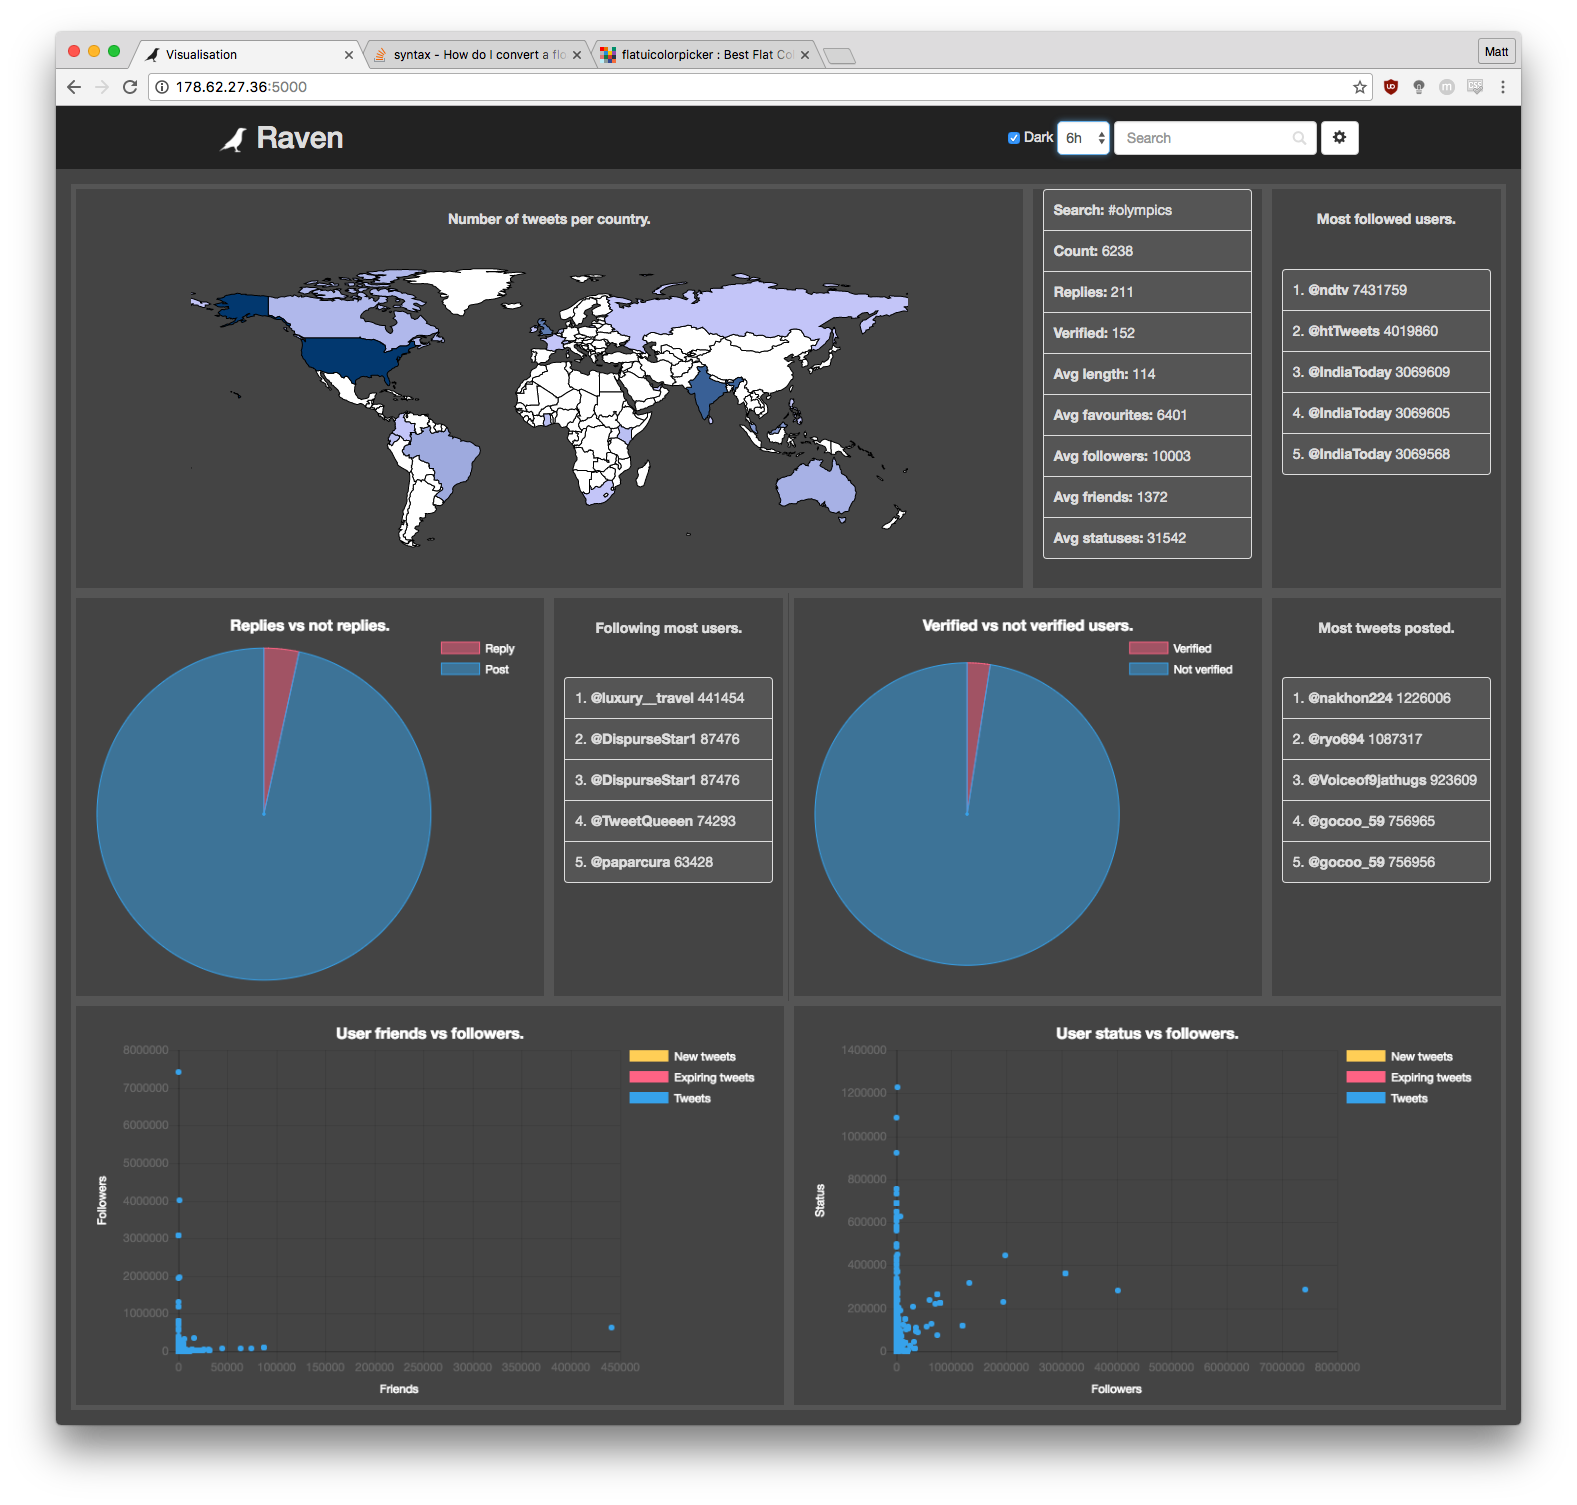
Have created multiple versions of both the pie charts and scatter charts (shown below). Each of the charts are completely separated. If one chart breaks the others should not be affected.

Entry 30 (21/08):
Added the world map heat map of number of tweets per location. Had lots of issues with fitting it to the cell box due to css added by the developer of the world map, but managed to get it to work as required in the end.

Entry 31 (22/08):
Added two similar listing items. 'top5' and 'summary' are both now available to use. Summary shows an overview of the data that is being used in the visualisation and 'top5' shows the five users with the highest score for one metric, for example, most followers.
Entry 32 (23/08):
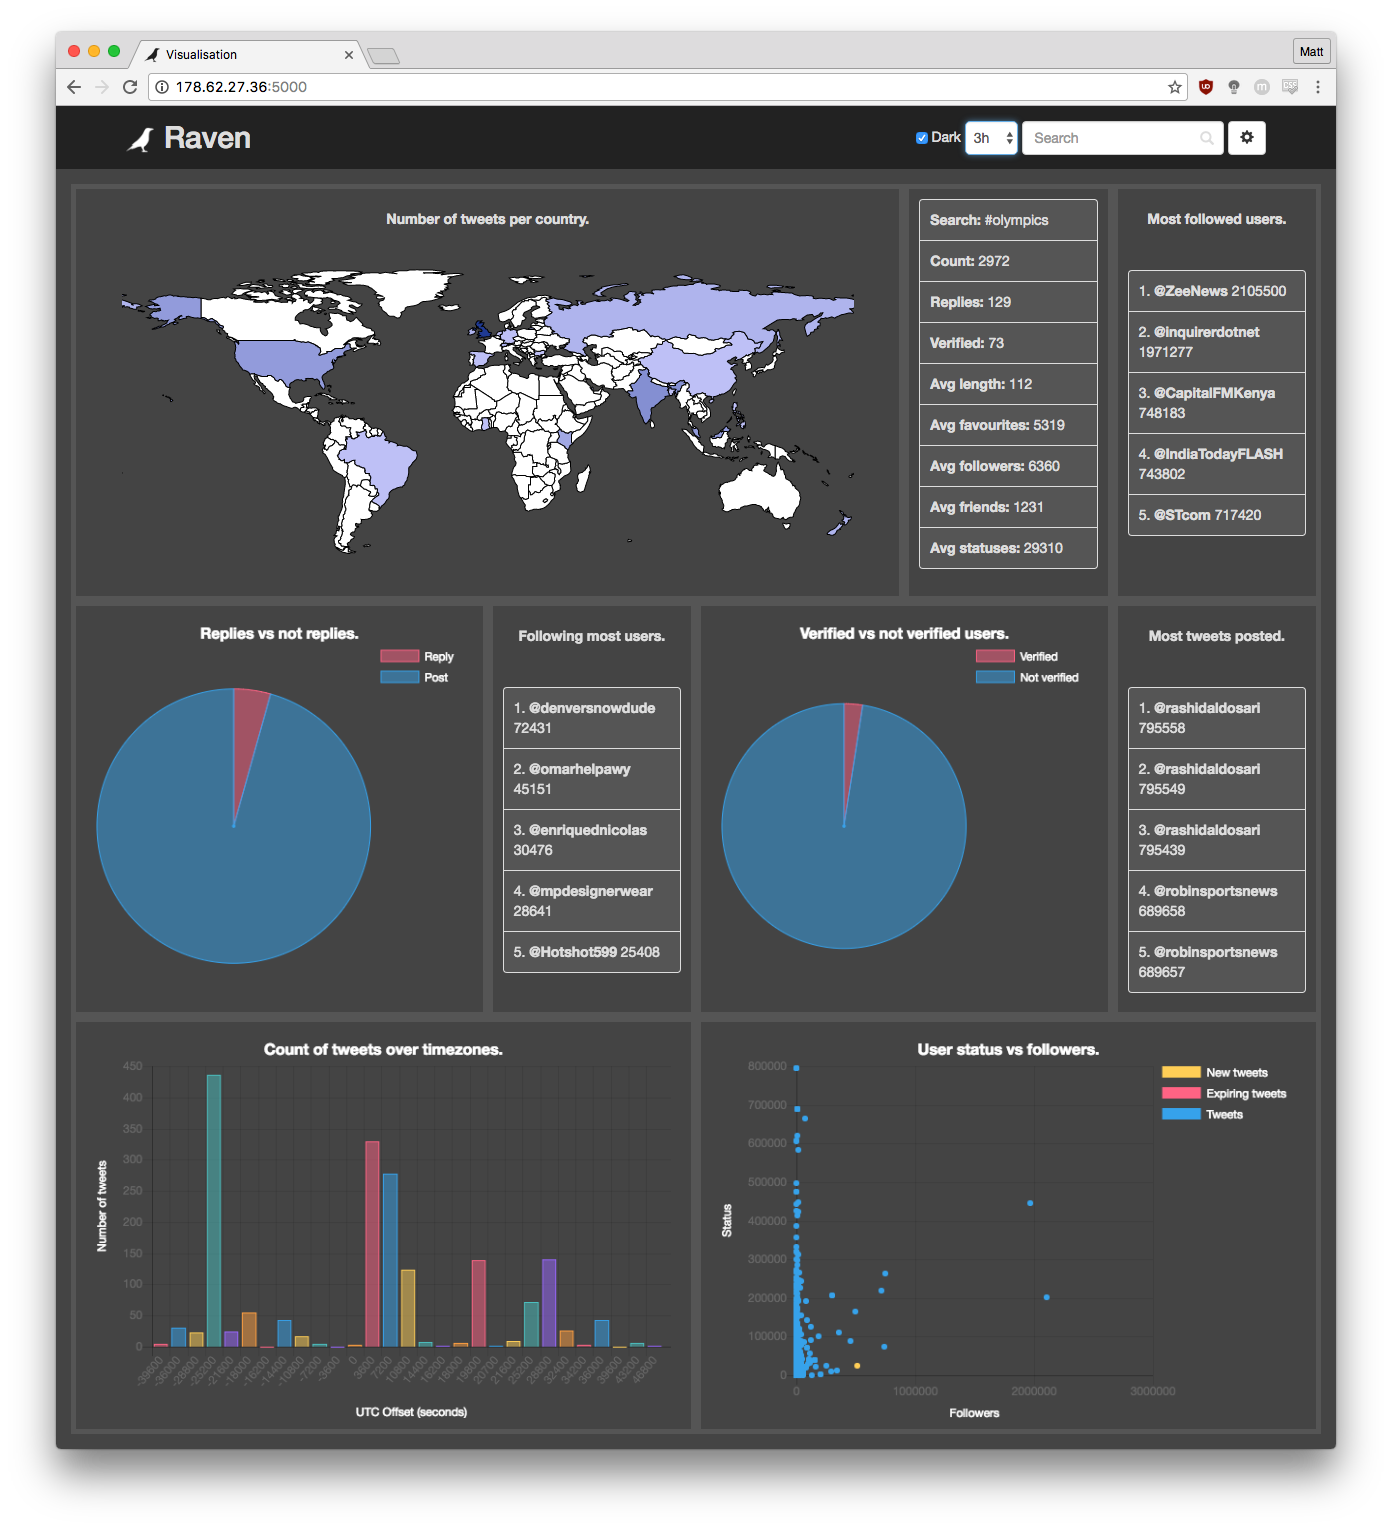
Added a bar chart using utc data to show roughly where in the world the users are. It is very interesting to place it under a world map and watch how the two compare.
Entry 33 (24/08):
Added the fixes talked about in our meeting today:
-
Fix the labels to show up on white background.
-
Add the number of located tweets to the summary pane.
-
Add a line graph similar to the early deliverable.

Completed screenshots:
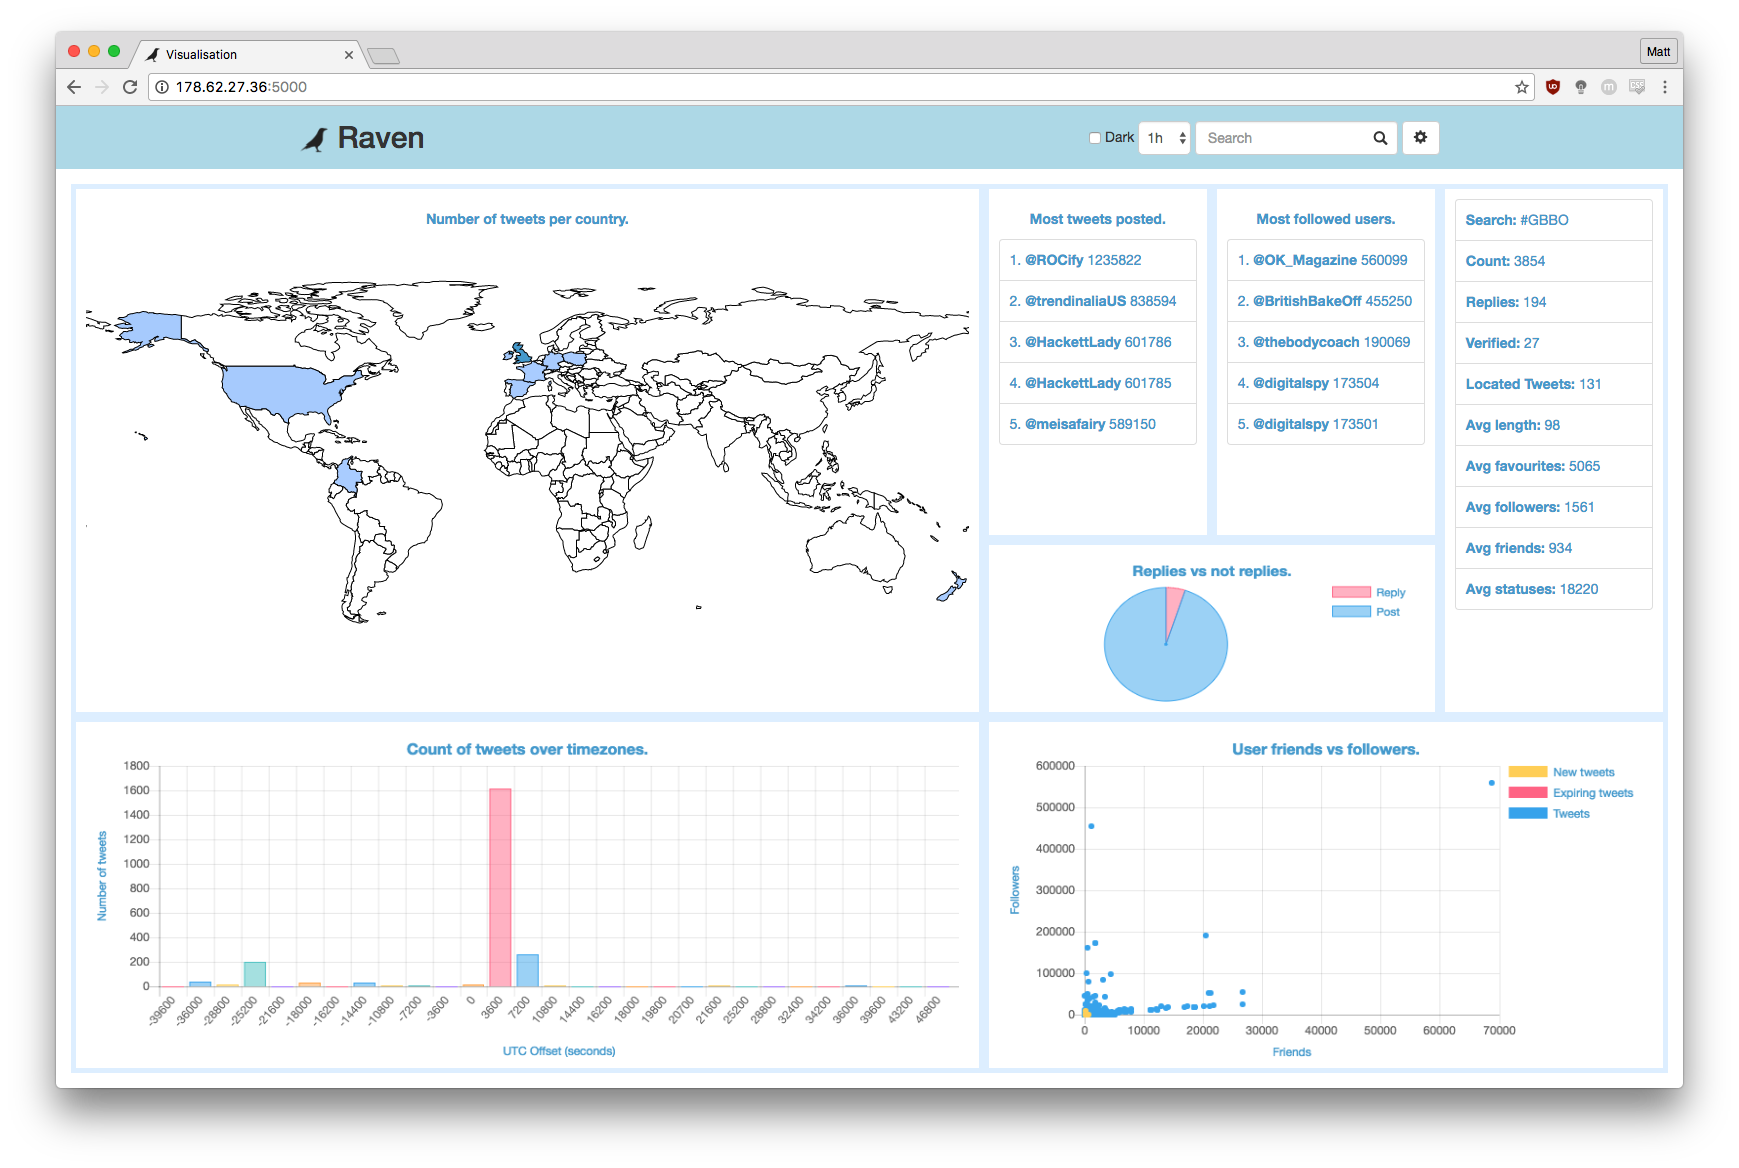
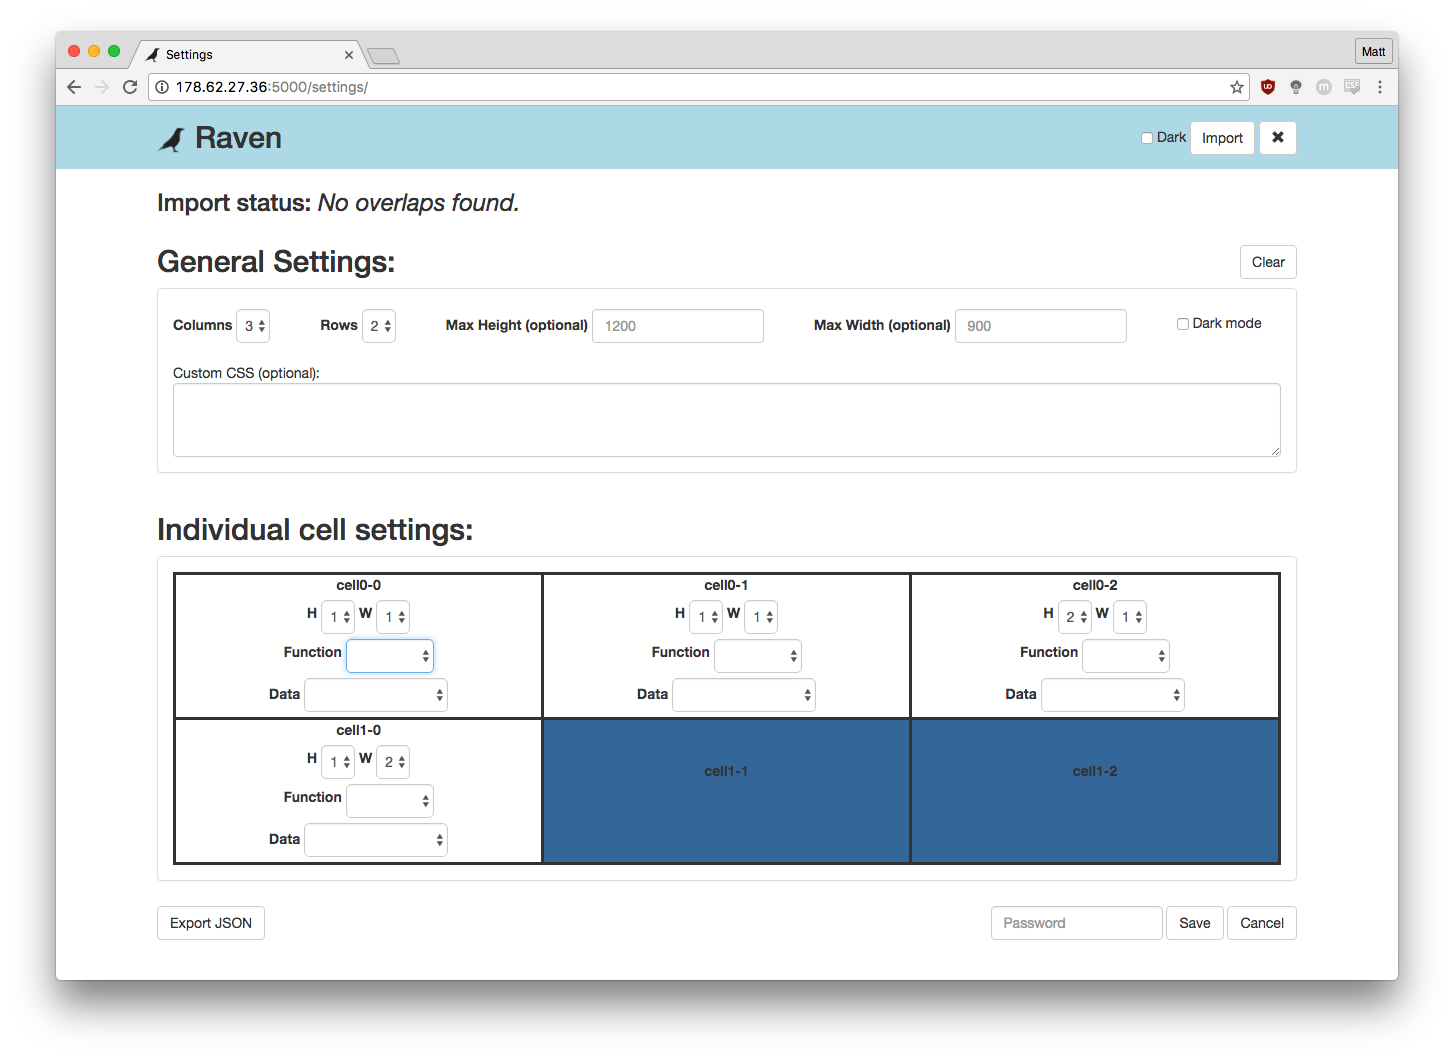
The application is now completed. Here is a screenshot of the final version of each page (the configuration of the application page can still change).
Application page
Settings page
Imports page
